|

AUD/USD Technical Analysis: 0.7070 gains sellers attention
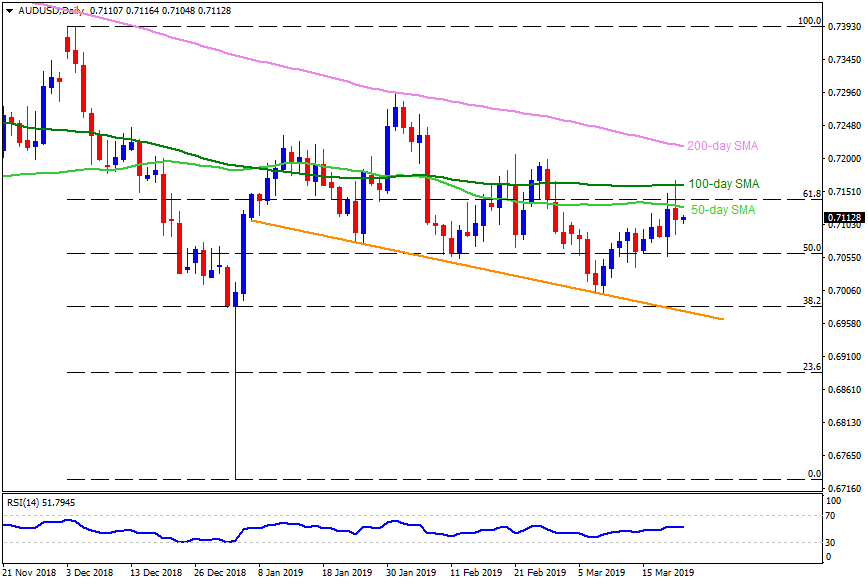
AUD/USD daily chart

  • The AUD/USD pair trades near 0.7110 around early Asian sessions on Friday.
  • The quote took a U-turn from 50-day and 100-day simple moving averages (SMA) on Thursday.
  • While multiple lows from mid-February to March start offers immediate support to the pair at 0.7070, 50% Fibonacci retracement of its December – January drop, at 0.7060, could challenge sellers then after.
  • Given the additional declines under 0.7060, 0.7030, 0.7000 and a descending trend-line joining 38.2% Fibonacci at 0.6980 seem crucial for bears.
  • Meanwhile, 50-day SMA level of 0.7130 and 100-day SMA level of 0.7160 can limit the pair’s near-term upside.
  • Should the pair clears 0.7160, 0.7200 may become buyers’ favorite ahead of pushing them towards 200-day SMA level of 0.7220.

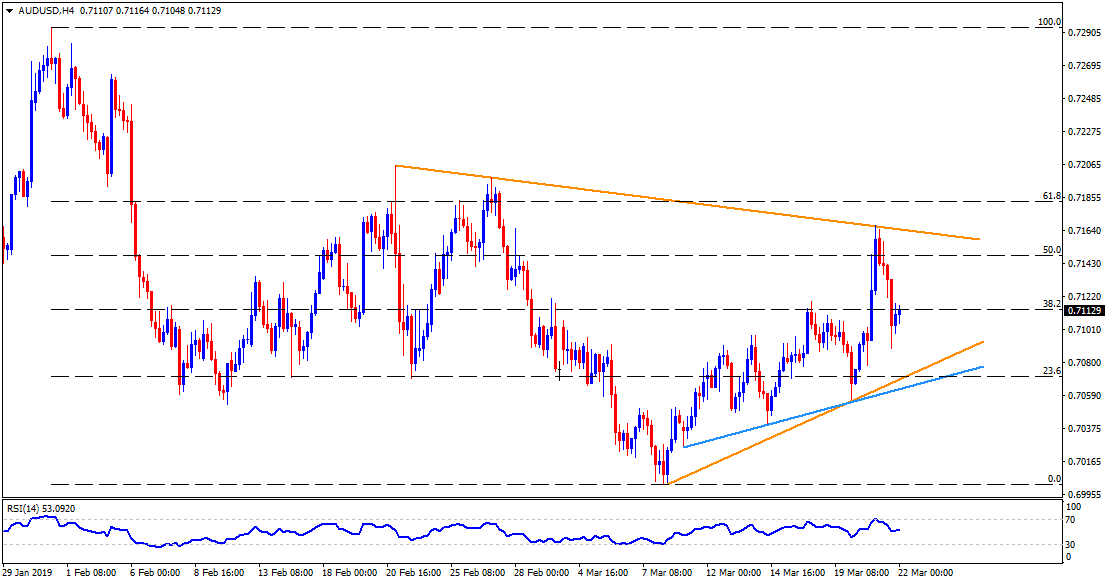
AUD/USD 4-Hour chart

  • Short-term symmetrical triangle confines the pair moves between 0.7070 and 0.7165 with additional support-line at 0.7060 acting as small follow-on rest.
  • 50% Fibonacci retracement of January 31 to March 08 downturn at 0.7150 can provide an intermediate halt between 0.7130 and 0.7150.

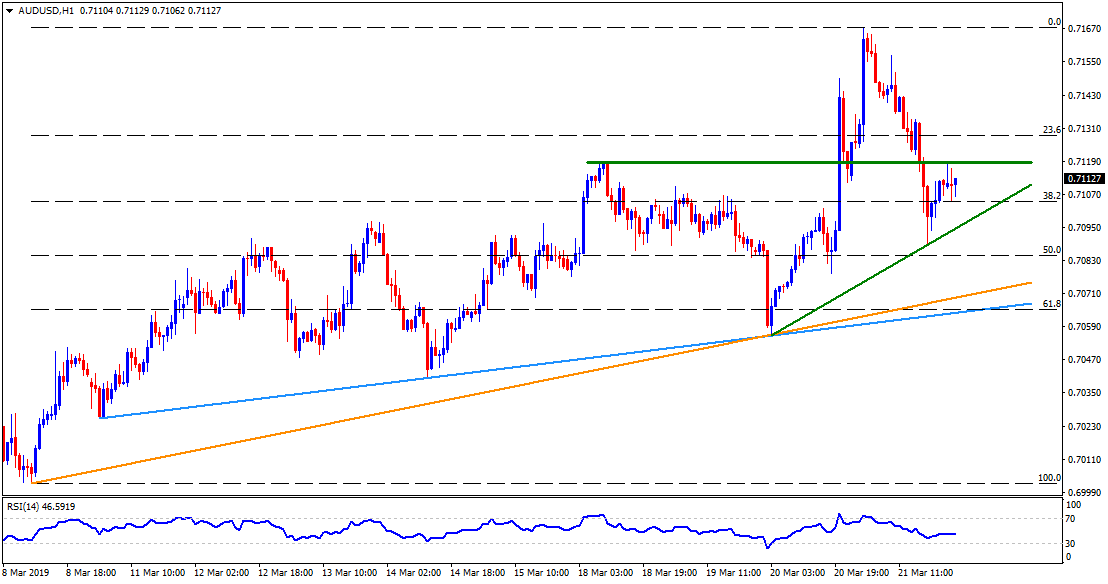
AUD/USD hourly chart

  • A horizontal line near 0.7120 may restrict the pair’s adjacent rise whereas 0.7095 seems the closest support.

Author

Anil Panchal

Anil Panchal

FXStreet

Anil Panchal has nearly 15 years of experience in tracking financial markets. With a keen interest in macroeconomics, Anil aptly tracks global news/updates and stays well-informed about the global financial moves and their implications.

More from Anil Panchal
Share:

Editor's Picks

EUR/USD tests nine-day EMA support near 1.1850

EUR/USD inches lower during the Asian hours on Monday, trading around 1.1870 at the time of writing. The 14-day Relative Strength Index momentum indicator at 56 stays above the midline, confirming improving momentum. RSI has cooled from prior overbought readings but stabilizes above 50, suggesting dips could stay limited before buyers reassert control.

GBP/USD flat lines as traders await key UK macro data and FOMC minutes

The GBP/USD pair kicks off a new week on a subdued note and oscillates in a narrow range, just below mid-1.3600s, during the Asian session. Moreover, the mixed fundamental backdrop warrants some caution for aggressive traders as the market focus now shifts to this week's important releases from the UK and the US.

Gold slides below $5,000 amid USD uptick and positive risk tone; downside seems limited

Gold attracts fresh sellers at the start of a new week and reverses a part of Friday's strong move up of over $150 from sub-$4,900 levels. The commodity slides back below the $5,000 psychological mark during the Asian session, though the downside potential seems limited amid a combination of supporting factors.

Bitcoin, Ethereum and Ripple consolidate within key ranges as selling pressure eases

Bitcoin and Ethereum prices have been trading sideways within key ranges following the massive correction. Meanwhile, XRP recovers slightly, breaking above the key resistance zone. The top three cryptocurrencies hint at a potential short-term recovery, with momentum indicators showing fading bearish signs.

Global inflation watch: Signs of cooling services inflation

Realized inflation landed close to expectations in January, as negative base effects weighed on the annual rates. Remaining sticky inflation is largely explained by services, while tariff-driven goods inflation remains limited even in the US.

Ripple Price Forecast: XRP potential bottom could be in sight

Ripple edges up above the intraday low of $1.35 at the time of writing on Friday amid mixed price actions across the crypto market. The remittance token failed to hold support at $1.40 the previous day, reflecting risk-off sentiment amid a decline in retail and institutional sentiment.