|

AUD/USD recovering into 0.6430 as US Dollar eases up

  • The AUD/USD is recovering into the back end of Thursday trading as risk appetite recovers.
  • The Aussie knocked into 0.6385 as US Dollar flows take the AUD back into familiar territory.
  • The week is set to cap off chart action with PMI figures for both Australia and the US.

The AUD/USD is catching a bounce heading into the back end of Thursday's market session, lifting into 0.6425 after hitting a near-term low of 0.6385.

The US Dollar (USD) took a ride up the charts across the board after yesterday's Federal Reserve (Fed) which saw the US central bank hold rates steady for the time being, but an increase in the Fed's rate outlook sees markets baking in at least one more rate hike for the year.

The Federal Open Market Committee (FOMC) sees the US interest rate at 5.1% by the end of 2024, a half-percentage point higher than originally expected. The potential for higher, longer Fed rates saw the Greenback gain ground against all of its global competitors, and markets are still scrambling to correct the slide.

Australian, US PMIs on Friday to close out the trading week

Friday markets will see Purchasing Manager Index (PMI) figures for both the AUD and the USD.

The Australian Composite PMI last printed at 48, while the US Composite PMI last came in at 50.2. Purchasing managers in both economies are seeing a discrepancy in economic activity. US purchasing managers see activity and prices rising in September, while their Australian counterparts are still facing a steepening of constraint factors for the Antipodean economy.

AUD/USD technical outlook

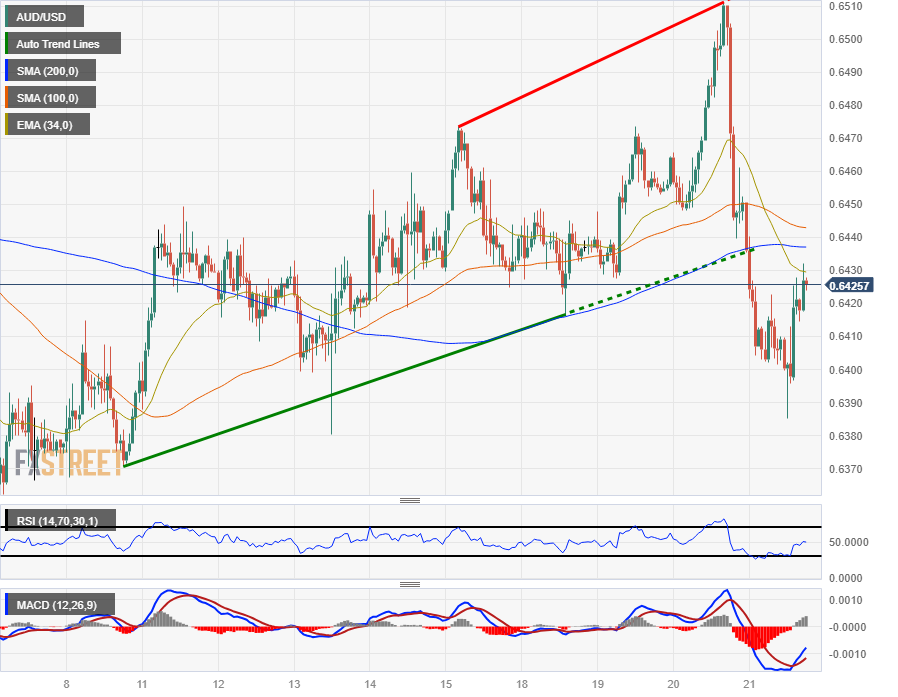
The Aussie tumbled from a near-term peak of 0.6510 on Thursday after the Fed threw gas over the USD, and the AUD/USD fell nearly 2% before recovering from a new floor at 0.6385.

The pair has slipped below the 200-hour Simple Moving Average (SMA) near 0.6440, and fallen to the bearish side of a rising trendline on hourly candles from last week's low end near 0.6370.

On the daily candlesticks, the AUD/USD continues to fall back into familiar consolidation territory. Wednesday's backslide saw the pair cleanly reject the 34-day Exponential Moving Average (EMA), and technical support comes from recent swing lows below 0.6375.

AUD/USD hourly chart
AUD/USD technical levels

AUD/USD

Overview
Today last price0.6426
Today Daily Change-0.0022
Today Daily Change %-0.34
Today daily open0.6448
 
Trends
Daily SMA200.643
Daily SMA500.6541
Daily SMA1000.6611
Daily SMA2000.6699
 
Levels
Previous Daily High0.6511
Previous Daily Low0.644
Previous Weekly High0.6474
Previous Weekly Low0.6378
Previous Monthly High0.6724
Previous Monthly Low0.6364
Daily Fibonacci 38.2%0.6467
Daily Fibonacci 61.8%0.6484
Daily Pivot Point S10.6421
Daily Pivot Point S20.6395
Daily Pivot Point S30.635
Daily Pivot Point R10.6493
Daily Pivot Point R20.6538
Daily Pivot Point R30.6564

Author

Joshua Gibson

Joshua joins the FXStreet team as an Economics and Finance double major from Vancouver Island University with twelve years' experience as an independent trader focusing on technical analysis.


More from Joshua Gibson
Share:

Editor's Picks

GBP/USD stays below 1.3400 after soft UK CPI data

GBP/USD struggles to gain traction and stays below 1.3400 in the second half of the day on Wednesday. The UK annual Consumer Price Index (CPI) inflation cooled to 2.6% in June against the market forecast of 2.7%, making it difficult for the British Pound gather recovery momentum. Meanwhile, investors keep a close eye on headlines coming out of the Middle East.

EUR/USD stabilizes near 1.1400 as markets focus on geopolitics

EUR/USD trades in a narrow channel at around 1.1400 on Wednesday. In the absence of high-impact data releases, escalating geopolitical tensions in the Middle East caps the pair's upside. On Thursday, the European Central Bank (ECB) will announce monetary policy decisions.

Gold holds gains above $4,100 undaunted by risk-off markets

Gold extends gains for the fourth consecutive day, standing comfortably above $4,100, unfazed by the risk-off market amid rising tensions in Iran and higher Oil prices. The pair has rallied nearly 2.5% so far this week and is on track for its best weekly performance in more than three months.

Cardano: Short-term recovery lacks retail support

Cardano price edges lower after the 50-day Exponential Moving Average at $1.770 capped two consecutive days of recovery seen earlier this week. ADA futures point to waning retail traction as Open Interest and trading volume decline amid elevated long liquidations. The technical outlook for ADA is bearish, as momentum remains subdued below a resistance trendline near $0.1782.

Chip stocks are more volatile than Oil

I continue to start the day by looking at these two charts: US crude & Kospi. The former is extending gains, trading above $86 per barrel for WTI and $92 per barrel for Brent, while the Kospi is up more than 4.5%, led higher by Korean chipmakers following a similar jump in VanEck's Semiconductor ETF yesterday.

US Dollar mid-year outlook: Exceptional currency, exceptional risks?
The US Dollar enters the second half of 2026 in a markedly different position from a year ago. The King currency has recovered, reflecting persistent US inflation, changing expectations for Fed policy, geopolitical tensions and renewed demand for defensive assets.














