AUD/USD Price Forecast: Turns sideways around 0.6660 as rally hits pause
- AUD/USD wobbles around 0.6660 as rally hits pause after weak Australian employment data.
- Investors await the US NFP data for fresh cues on the Fed’s monetary policy outlook.
- The Fed has lowered interest rates this year due to weak job market conditions.

The AUD/USD pair turns sideways as the three-week rally hits a pause after posting a fresh three-month high at 0.6686 on Wednesday. During Friday’s early European trading hours, the Aussie pair trades calmly near 0.6660.
Australian Dollar Price This week
The table below shows the percentage change of Australian Dollar (AUD) against listed major currencies this week. Australian Dollar was the strongest against the Japanese Yen.
| USD | EUR | GBP | JPY | CAD | AUD | NZD | CHF | |
|---|---|---|---|---|---|---|---|---|
| USD | -0.81% | -0.51% | 0.30% | -0.43% | -0.45% | -0.73% | -1.16% | |
| EUR | 0.81% | 0.33% | 1.15% | 0.42% | 0.40% | 0.12% | -0.33% | |
| GBP | 0.51% | -0.33% | 0.86% | 0.09% | 0.08% | -0.21% | -0.65% | |
| JPY | -0.30% | -1.15% | -0.86% | -0.72% | -0.73% | -1.00% | -1.44% | |
| CAD | 0.43% | -0.42% | -0.09% | 0.72% | -0.01% | -0.29% | -0.74% | |
| AUD | 0.45% | -0.40% | -0.08% | 0.73% | 0.01% | -0.29% | -0.72% | |
| NZD | 0.73% | -0.12% | 0.21% | 1.00% | 0.29% | 0.29% | -0.44% | |
| CHF | 1.16% | 0.33% | 0.65% | 1.44% | 0.74% | 0.72% | 0.44% |
The heat map shows percentage changes of major currencies against each other. The base currency is picked from the left column, while the quote currency is picked from the top row. For example, if you pick the Australian Dollar from the left column and move along the horizontal line to the US Dollar, the percentage change displayed in the box will represent AUD (base)/USD (quote).
The pair struggles to extend its advance after the release of the unexpectedly weak Australian labor market data for November. The data released on Thursday showed that the economy shed 21.3K jobs in November, while it was expected to have added 20K fresh workers, raising concerns over the labor market strength.
Meanwhile, investors shift their focus to the United States (US) Nonfarm Payrolls (NFP) data for November, which will be released on Tuesday.
Investors will pay close attention to the US NFP data as its impact on market expectations for the Federal Reserve’s (Fed) monetary policy outlook is expected to be high. In the last three monetary policy meetings, the Fed has lowered interest rates by 75 basis points (bps) to 3.50%-3.75%, citing downside risks to employment.
As of writing, the US Dollar Index (DXY), which tracks the Greenback’s value against six major currencies, trades with caution near its seven-week low of 98.13 posted on Thursday.
AUD/USD technical analysis
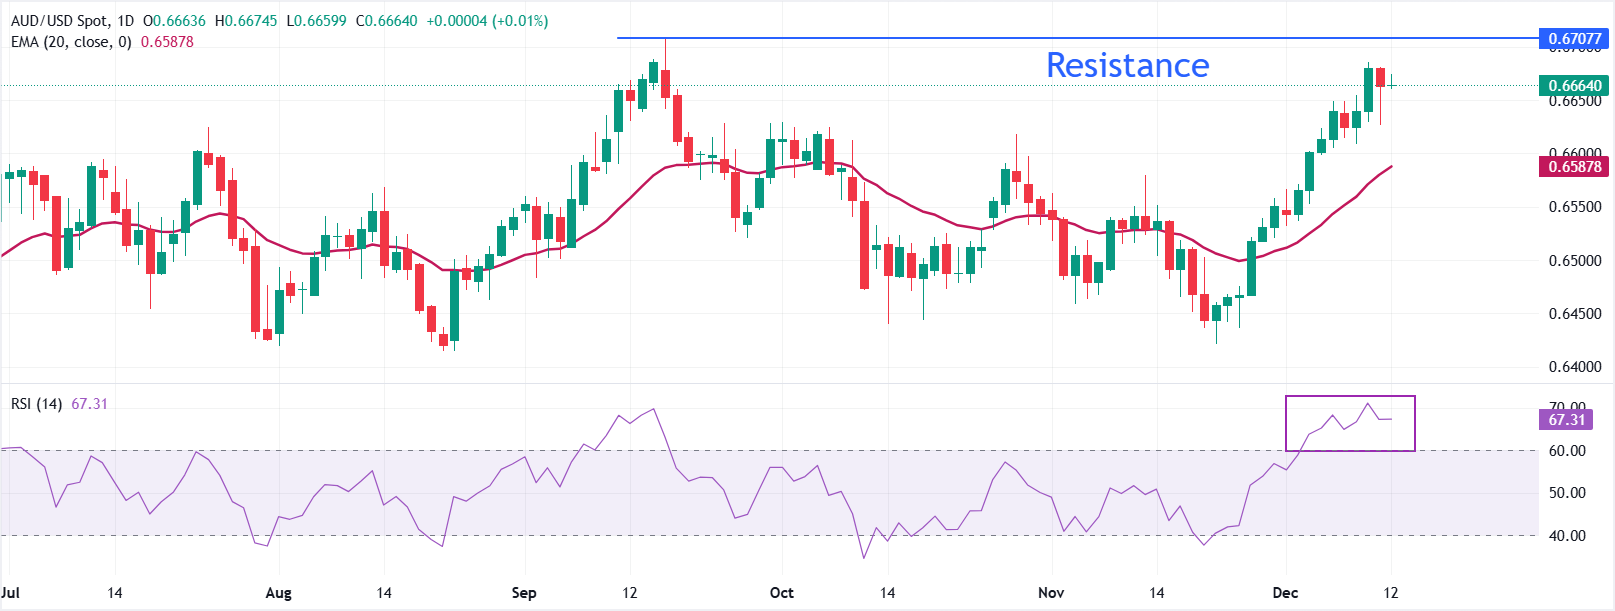
AUD/USD trades stably near 0.6660 in the early European session on Friday. The pair holds above a rising 20-Exponential Moving Average (EMA), now at 0.6588, which supports the bullish bias. The 20-day EMA has been ascending for several sessions and continues to guide the trend higher.
The 14-day Relative Strength Index (RSI) at 67 (bullish, near overbought) confirms firm momentum while edging toward a stretch where gains could slow.
With momentum elevated, bulls retain control, though the proximity to overbought conditions could temper follow-through and encourage consolidation. A pullback would be expected to find demand on approaches to the rising average, while a close below it would open room for a broader corrective phase towards the November 14 high of 0.6551; otherwise, the broader bias would remain upward as long as price action respects the trend proxy. Looking up, the advance could extend towards the September 17 high of 0.6707.
(The technical analysis of this story was written with the help of an AI tool)
US Dollar FAQs
The US Dollar (USD) is the official currency of the United States of America, and the ‘de facto’ currency of a significant number of other countries where it is found in circulation alongside local notes. It is the most heavily traded currency in the world, accounting for over 88% of all global foreign exchange turnover, or an average of $6.6 trillion in transactions per day, according to data from 2022. Following the second world war, the USD took over from the British Pound as the world’s reserve currency. For most of its history, the US Dollar was backed by Gold, until the Bretton Woods Agreement in 1971 when the Gold Standard went away.
The most important single factor impacting on the value of the US Dollar is monetary policy, which is shaped by the Federal Reserve (Fed). The Fed has two mandates: to achieve price stability (control inflation) and foster full employment. Its primary tool to achieve these two goals is by adjusting interest rates. When prices are rising too quickly and inflation is above the Fed’s 2% target, the Fed will raise rates, which helps the USD value. When inflation falls below 2% or the Unemployment Rate is too high, the Fed may lower interest rates, which weighs on the Greenback.
In extreme situations, the Federal Reserve can also print more Dollars and enact quantitative easing (QE). QE is the process by which the Fed substantially increases the flow of credit in a stuck financial system. It is a non-standard policy measure used when credit has dried up because banks will not lend to each other (out of the fear of counterparty default). It is a last resort when simply lowering interest rates is unlikely to achieve the necessary result. It was the Fed’s weapon of choice to combat the credit crunch that occurred during the Great Financial Crisis in 2008. It involves the Fed printing more Dollars and using them to buy US government bonds predominantly from financial institutions. QE usually leads to a weaker US Dollar.
Quantitative tightening (QT) is the reverse process whereby the Federal Reserve stops buying bonds from financial institutions and does not reinvest the principal from the bonds it holds maturing in new purchases. It is usually positive for the US Dollar.
Author

Sagar Dua
FXStreet
Sagar Dua is associated with the financial markets from his college days. Along with pursuing post-graduation in Commerce in 2014, he started his markets training with chart analysis.


