AUD/USD Price Forecast: Continues posting green candlesticks as it pushes higher
- AUD/USD edges higher towards the top of a long-term range.
- Momentum is diverging bearishly with price, however, suggesting a risk of a pullback evolving.

AUD/USD keeps posting green candlesticks as it steadily creeps higher. The pair hit a new 2024 high of 0.6839 on Thursday and although there is not much spare room left above until it touches the long-term range high at 0.6870, the trend is short-term bullish, so it’s quite possible it could continue higher.
AUD/USD Daily Chart
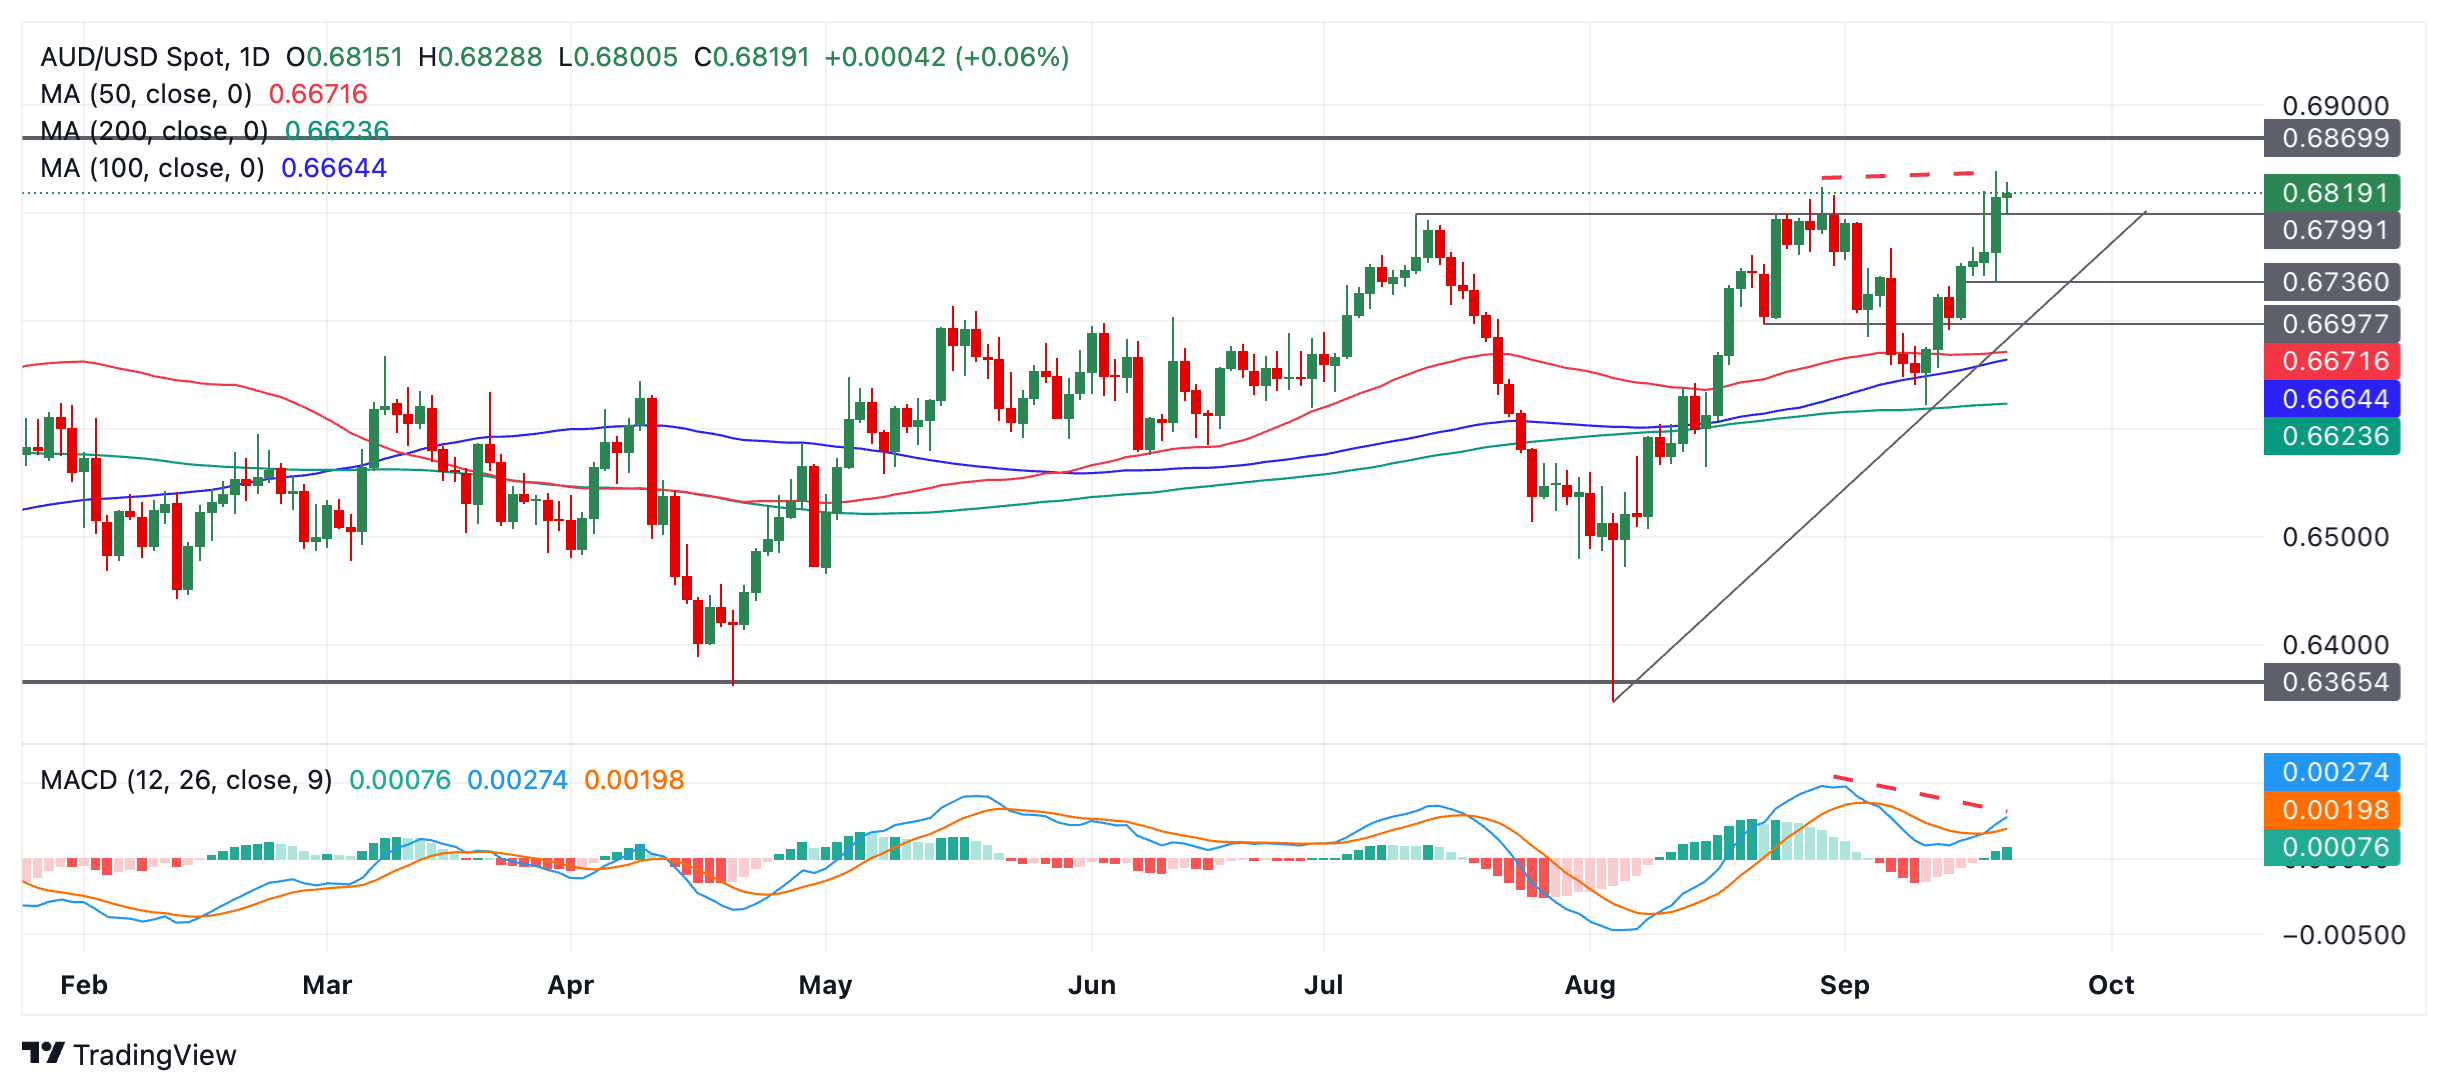
The Aussie is showing mild bearish divergence with the Relative Strength Index (RSI) momentum indicator (red dashed lines on chart above). This occurs when the price reaches a new high but the RSI fails to. The non confirmation is a bearish sign and indicates mild underlying weakness. It suggests AUD/USD is at risk of pulling back.
If a correction evolves it is likely to find support at around 0.6800 (July high), followed by 0.6736.
AUD/USD is in a short-term uptrend since the September 11 low and given it is a principle of technical analysis that “the trend is your friend” the odds favor a continuation higher eventually – despite the bearish divergence with RSI.
A break above the 0.6839 (September 19 and yearly high) would confirm a continuation of the uptrend to a target at the 0.6870 level (December 2023 high).
Author

Joaquin Monfort
FXStreet
Joaquin Monfort is a financial writer and analyst with over 10 years experience writing about financial markets and alt data. He holds a degree in Anthropology from London University and a Diploma in Technical analysis.


