AUD/USD Price Forecast: Aussie returns above 0.6700 on US Dollar’s weakness
- AUD/USD returns to levels right above 0.6700 after bouncing from 0.6660 lows.
- A fresh rift between Trump and Powell has put the Fed's independence into focus.
- Recent price action highlights a potential bearish H&S formation.

The Australian Dollar is posting a significant recovery against the US Dollar on Monday. The pair has returned to levels above 0.6700 during the European session, after bouncing near 0.6670, as renewed political pressure on the US Federal Reserve (Fed) has sent the Greenback tumbling against its main peers.
The New York Times reported on Sunday that the US government initiated a criminal investigation into Federal Reserve Chair Jerome Powell, which was described as “unprecedented action” and the latest in a series of attempts to intimidate the US central bank. The news has brought the question Fed’s independence back to the table, and might erode investors’ confidence in the US Dollar as a reserve currency.
Technical Analysis: A bearish H&S might be in progress
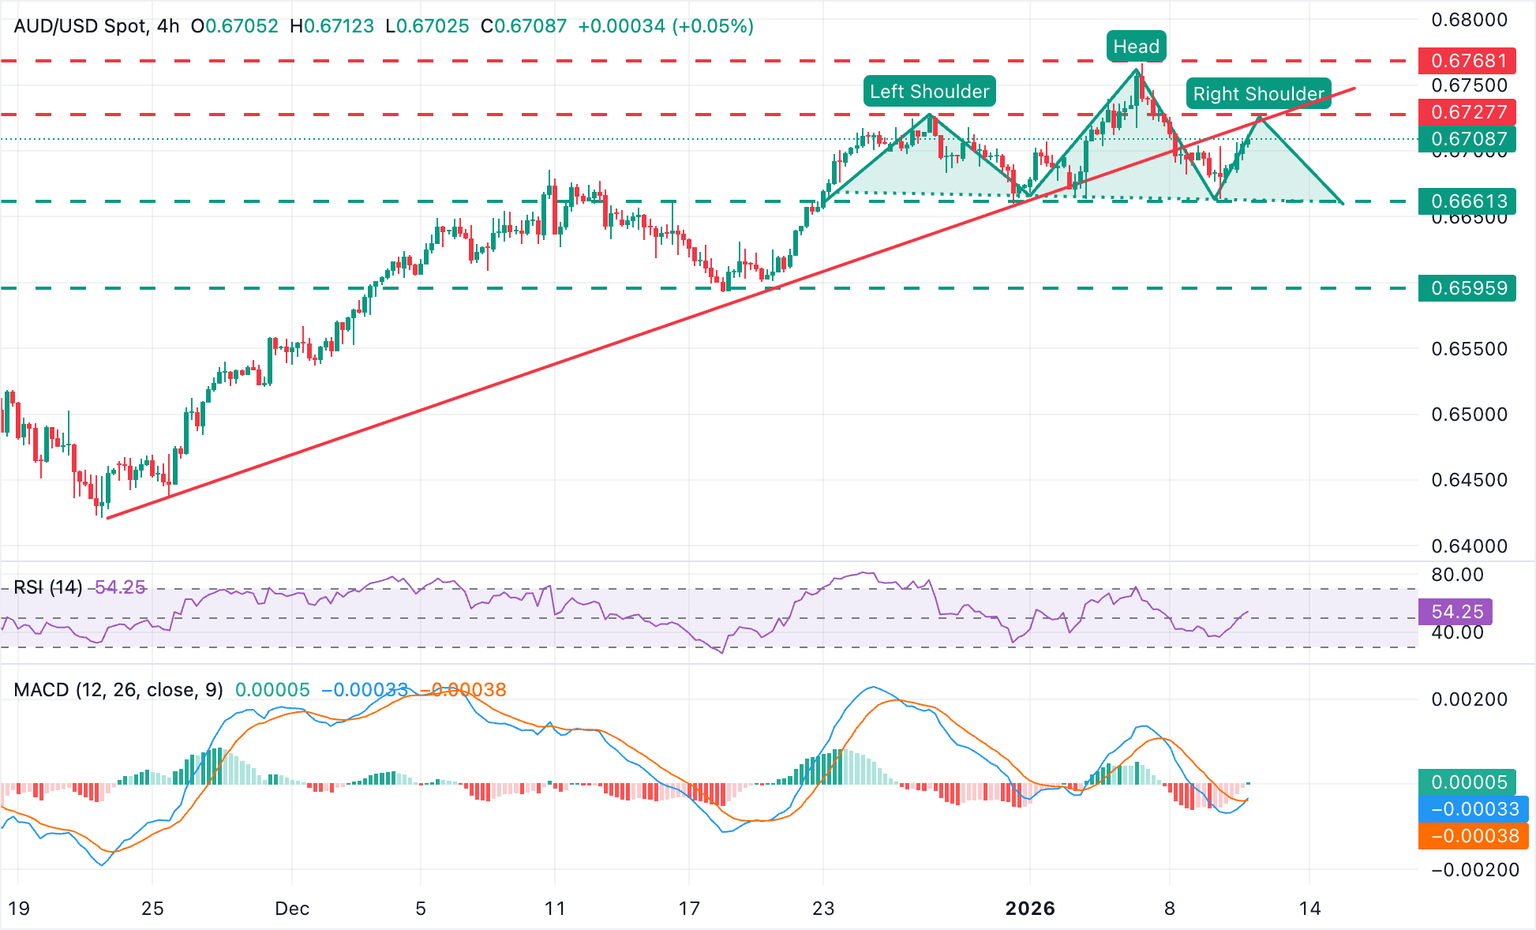
The 4-hour chart shows AUD/USD trading at 0.6711 amid an improving bullish momentum. The Relative Strength Index (14) is at 55, showing a mild bullish trend, and the Moving Average Convergence Divergence (MACD) line has crossed over the Signal line, highlighting an improving momentum.
The pair is approaching a key resistance at the 0.6730 area, where the reverse trendline might challenge bulls. Failure here would add pressure towards 0.6660 (December 31, January 5 low), which is the neckline of a bearish Head & Shoulders pattern. Further down, the 0.6595 area (December 18 low) comes into focus.
A confirmation above 0.6730, on the contrary, would clear the path for a retest of the three-month high, at 0.6770, hit last week.
(The technical analysis of this story was written with the help of an AI tool.)
US Dollar Price Today
The table below shows the percentage change of US Dollar (USD) against listed major currencies today. US Dollar was the strongest against the Japanese Yen.
| USD | EUR | GBP | JPY | CAD | AUD | NZD | CHF | |
|---|---|---|---|---|---|---|---|---|
| USD | -0.40% | -0.42% | -0.02% | -0.27% | -0.30% | -0.48% | -0.45% | |
| EUR | 0.40% | -0.01% | 0.39% | 0.12% | 0.10% | -0.08% | -0.05% | |
| GBP | 0.42% | 0.01% | 0.40% | 0.14% | 0.12% | -0.06% | -0.03% | |
| JPY | 0.02% | -0.39% | -0.40% | -0.25% | -0.27% | -0.45% | -0.42% | |
| CAD | 0.27% | -0.12% | -0.14% | 0.25% | -0.02% | -0.20% | -0.17% | |
| AUD | 0.30% | -0.10% | -0.12% | 0.27% | 0.02% | -0.19% | -0.15% | |
| NZD | 0.48% | 0.08% | 0.06% | 0.45% | 0.20% | 0.19% | 0.03% | |
| CHF | 0.45% | 0.05% | 0.03% | 0.42% | 0.17% | 0.15% | -0.03% |
The heat map shows percentage changes of major currencies against each other. The base currency is picked from the left column, while the quote currency is picked from the top row. For example, if you pick the US Dollar from the left column and move along the horizontal line to the Japanese Yen, the percentage change displayed in the box will represent USD (base)/JPY (quote).
Author

Guillermo Alcala
FXStreet
Graduated in Communication Sciences at the Universidad del Pais Vasco and Universiteit van Amsterdam, Guillermo has been working as financial news editor and copywriter in diverse Forex-related firms, like FXStreet and Kantox.


