|

AUD/USD Price Analysis: Test of a fresh two-year low at 0.6360 looks imminent

  • Aussie bulls to test the two-year low at 0.6360.
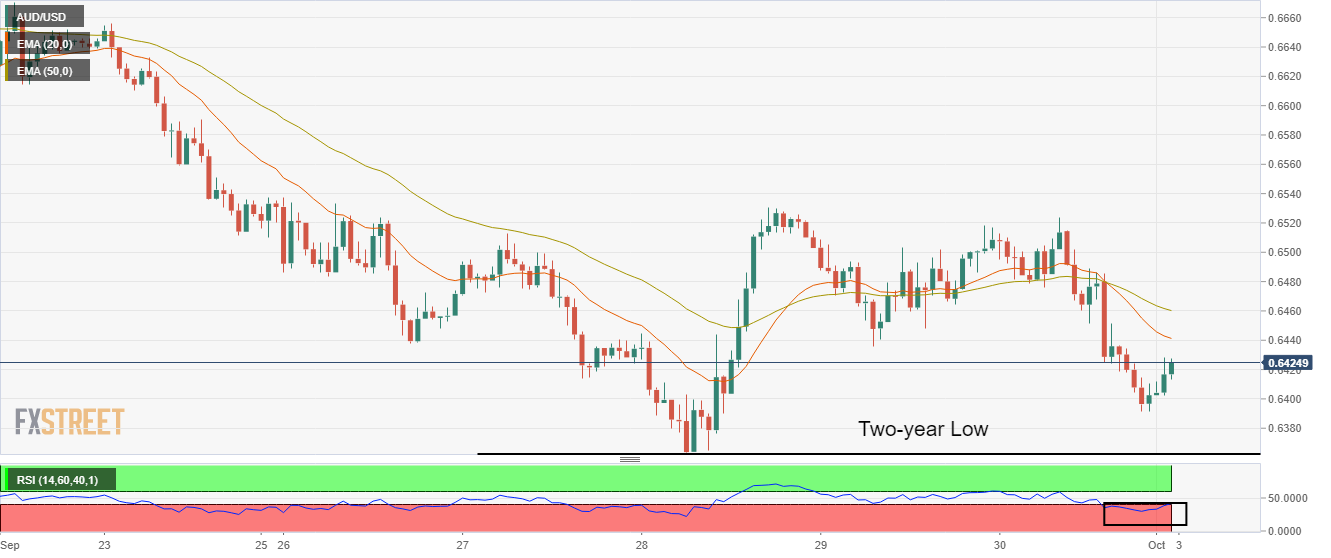
  • A bear cross, represented by the 20-and 50-EMAs adds to the downside filters.
  • The antipodean has failed to capitalize on the recent DXY's correction.

The AUD/USD pair has rebounded sharply in the Tokyo session after dropping below 0.6400. The rebound move is still a pullback after a healthy decline and should not be considered a reversal for now. Last week, the aussie bulls found a cap at around 0.6530, the level is expected to remain a key hurdle if the asset extends its recovery.

On an hourly scale, the aussie bulls are expected to re-test their two-year low placed at 0.6363, recorded on Wednesday. Traders should be aware of the fact that a recent corrective action in the US dollar index (DXY) is not enjoyed by the commodity-linked currencies while the shared continent and pound region have performed extremely better. Therefore, a pullback move in the DXY will result in a plunge in the antipodean.

The 20-and 50-period Exponential Moving Averages (EMAs) have delivered a bear cross around 0.6480, which indicates more weakness ahead.

Meanwhile, the Relative Strength Index (RSI) (14) is oscillating in a bearish range of 20.00-40.00 but is trying to overstep 40.00.

A drop below the two-year low at 0.6363 will drag the asset towards the 16 April 2020 low at 0.6264, followed by the round-level support at 0.6100.

On the flip side, a break above the previous week’s high at 0.6538 will drive the asset towards and September 22 high at 0.6670 and September 18 high at 0.6734.

AUD/USD hourly chart

AUD/USD

Overview
Today last price0.642
Today Daily Change0.0018
Today Daily Change %0.28
Today daily open0.6402
 
Trends
Daily SMA200.6661
Daily SMA500.6834
Daily SMA1000.6904
Daily SMA2000.7076
 
Levels
Previous Daily High0.6524
Previous Daily Low0.6392
Previous Weekly High0.6538
Previous Weekly Low0.6363
Previous Monthly High0.6916
Previous Monthly Low0.6363
Daily Fibonacci 38.2%0.6442
Daily Fibonacci 61.8%0.6473
Daily Pivot Point S10.6355
Daily Pivot Point S20.6307
Daily Pivot Point S30.6222
Daily Pivot Point R10.6487
Daily Pivot Point R20.6572
Daily Pivot Point R30.6619

Author

Sagar Dua

Sagar Dua

FXStreet

Sagar Dua is associated with the financial markets from his college days. Along with pursuing post-graduation in Commerce in 2014, he started his markets training with chart analysis.

More from Sagar Dua
Share:

Editor's Picks

GBP/USD bounces off lows, back above 1.3200

After bottoming out near 1.3160, GBP/USD manages to regain a bit of shine and reclaim the 1.3200 mark and beyond at the end of the week. Stronger-than-expected UK Retail Sales data seem to be helping the British Pound limit its losses, while the chaotic UK political environment keeps the bulls at bay for now.

EUR/USD looks consolidative around 1.1460

EUR/USD stages a modest rebound after slipping to a three-month low below 1.1420 at the end of the week. That said, the pair now looks to consolidate humble gains just above 1.1460 despite growing uncertainty surrounding the next round of US-Iran negotiations, which keeps the US Dollar’s downside contained.

Gold remains vulnerable, targets $4,100

Gold retreats for the fourth consecutive day on Monday, targeting the key $4,100 mark per troy ounce. The precious metal continues to face headwinds from the Fed's hawkish stance and renewed uncertainty surrounding the US-Iran negotiations.

Breaking: Iran closes the Strait of Hormuz amid ceasefire deal violation
Iran says it is closing the Strait of Hormuz after accusing the United States (US) and Israel of violating the ceasefire. According to Iran, the decision came over the continued Israeli strikes in Lebanon. The Iranian Revolutionary Guard Corps Navy issued a warning to all vessels: "Do not approach the Strait of Hormuz; otherwise, your security will be jeopardized."
The Iran war didn't break the US economy, but what happens next?

Nearly four months after the start of the Iran war, the US economy remains remarkably resilient. While the conflict initially triggered a severe disruption to global energy markets and a sharp rise in Oil prices, recent diplomatic progress between Washington and Tehran has eased concerns about a prolonged supply shock.

Regime change: Inside Kevin Warsh's first move to make the Fed unreadable on purpose

The rate did not move. That was the least interesting thing about Kevin Warsh's first meeting in charge of the Fed. The FOMC held its benchmark at 3.50%-3.75% for the fourth straight meeting, exactly as priced, and then the new chair used his first press conference to dismantle the machinery the market has leaned on for a decade.