|

AUD/USD Price Analysis: Resumes upside journey as USD Index drops further ahead of US Inflation

  • AUD/USD pair has resumed its upside journey amid a correction in the US Dollar Index.
  • The USD Index has refreshed its day’s low at 101.54 as a delay in US debt ceiling issues is impacting US long-term outlook.
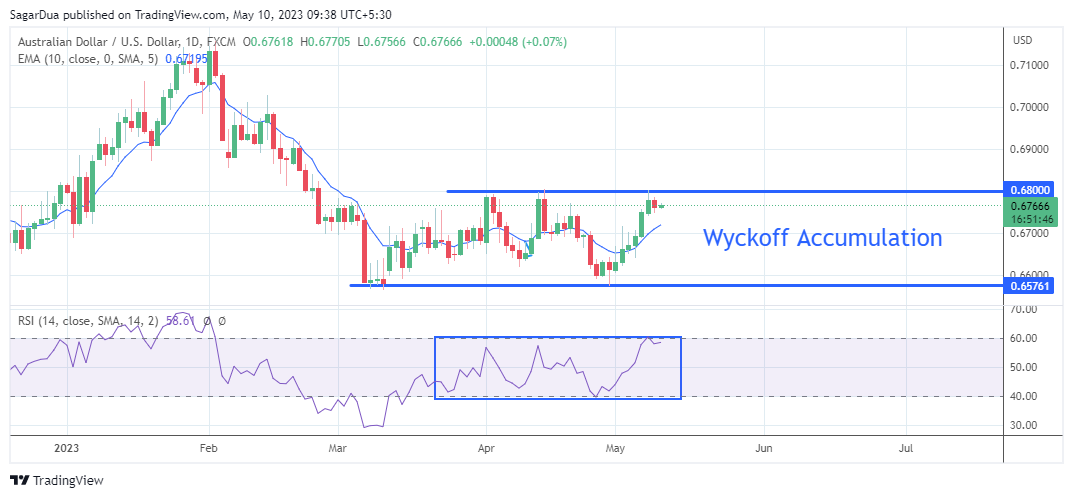
  • AUD/USD is oscillating in an accumulation phase in which inventory is shifted from retail participants to institutional investors.

The AUD/USD pair has resumed its upside journey after a corrective move to near 0.6750 in the Tokyo session. A solid recovery in the Aussie asset is being supported by a further correction in the US Dollar Index (DXY). The USD Index has refreshed its day’s low at 101.54 as a delay in US debt ceiling issues is impacting the long-term outlook of the United States economy.

Meanwhile, headlines that US Trade Chief Tai will meet Chinese commerce minister Wang Wentao in Detroit later in May is expected to keep the Australian Dollar active. Positive developments in the meeting would bring prosperity to their trade relations. It is worth noting that Australia is the leading trading partner of China and healthy trade relations in Sino-US will also improve opportunities for Australia.

AUD/USD is oscillating broadly in Wyckoff’s Accumulation phase in which inventory is shifted from retail participants to institutional investors. A breakout of the same results in wider bullish ticks and heavy volume.

The 10-period Exponential Moving Average (EMA) at 0.6721 is providing support to the Australian Dollar bulls.

Also, the Relative Strength Index (RSI) (14) is making efforts for climbing into the 60.00-80.00 range as it would trigger the upside momentum.

An acceptance above the round-level resistance at 0.6800 confidently, Australian Dollar bulls will firmly drive the asset higher toward February 06 low at 0.6855 followed by February 21 high at 0.6920.

In an alternate scenario, US Dollar bulls will flex their muscles if the Aussie asset will drop below March 15 low at 0.6590. An occurrence of the same will expose the asset to March 08 low at 0.6568 followed by 02 November 2022 high around 0.6500.

AUD/USD daily chart
AUD/USD

Overview
Today last price0.6768
Today Daily Change0.0006
Today Daily Change %0.09
Today daily open0.6762
 
Trends
Daily SMA200.6693
Daily SMA500.6685
Daily SMA1000.679
Daily SMA2000.6727
 
Levels
Previous Daily High0.6787
Previous Daily Low0.6746
Previous Weekly High0.6757
Previous Weekly Low0.6607
Previous Monthly High0.6806
Previous Monthly Low0.6574
Daily Fibonacci 38.2%0.6762
Daily Fibonacci 61.8%0.6771
Daily Pivot Point S10.6743
Daily Pivot Point S20.6725
Daily Pivot Point S30.6703
Daily Pivot Point R10.6784
Daily Pivot Point R20.6805
Daily Pivot Point R30.6824

Author

Sagar Dua

Sagar Dua

FXStreet

Sagar Dua is associated with the financial markets from his college days. Along with pursuing post-graduation in Commerce in 2014, he started his markets training with chart analysis.


More from Sagar Dua
Share:

Editor's Picks

AUD/USD keeps range near 0.6950 after Australian trade data

AUD/USD consolidates near a two-month low, trading around mid-0.6900s in the Asian session on Thursday amid a bullish US Dollar. The US PCE data tempered October Fed hike bets, though oil-driven inflation fears remain supportive of elevated US bond yields. Meanwhile, Australia's trade surplus shrank sharply in August to AUD495M, having limited impact on the Aussie Dollar and the pair.


USD/JPY sits at weekly top above 158.00 as bullish USD counters intervention risks

USD/JPY is sitting at the top end of its weekly range above 158.00 in the Asian session on Thursday. Despite the softer US PCE data, oil-driven inflation risks keep US bond yields elevated near multi-year highs. Moreover, the US-Iran standoff benefits the safe-haven US Dollar and supports the pair. Broad US Dollar strength counters hawkish BoJ expectations and Japanese intervention risks.

Gold fails ahead of $4,200 as surging US yields and Iran risks lift USD closer to YTD top

Gold struggles to capitalize on a modest intraday move up to the $4,200 neighborhood, trading nearly unchanged for the day during the first half of the European session. Despite softer-than-expected US inflation data on Wednesday, US Dollar buying remains unabated as US bond yields continue scaling new multi-year highs. This is seen as a key factor undermining demand for the non-yielding bullion.

Hyperliquid pares gains as ETF outflows cap tentative bullish recovery

Hyperliquid (HYPE) is down 2% at press time on Thursday, trimming its 5% gains from the previous day. Institutional demand is easing, with $5 million in outflows on Wednesday, weighing on near-term investors' sentiment. The technical outlook for HYPE indicates a near-term mixed tone as the price remains capped below $90.

The Euro is near a one-year low: Inflation could trigger its rebound, not its fall

EUR/USD has fallen to its lowest level since May 2025, but a fresh inflation shock in the Eurozone could give the Euro an unexpected lifeline. The pair hit 1.1312 on Wednesday and trades well below the January peak of 1.2082. The decline reflects a powerful combination of US Dollar strength, geopolitical uncertainty and renewed concerns about Europe's exposure to higher energy prices.

The Euro is near a one-year low: Inflation could trigger its rebound, not its fall

EUR/USD has fallen to its lowest level since May 2025, but a fresh inflation shock in the Eurozone could give the Euro (EUR) an unexpected lifeline. The pair hit 1.1312 on Wednesday and trades well below the January peak of 1.2082.














