|

AUD/USD Price Analysis: Rebounds sharply as Aussie PMI remains upbeat

  • AUD/USD has shown some resilience above 0.6650 after the release of better-than-projected Aussie PMI data.
  • The USD Index has recovered its entire losses posted in early Asia despite the further delay in US debt-ceiling raise.
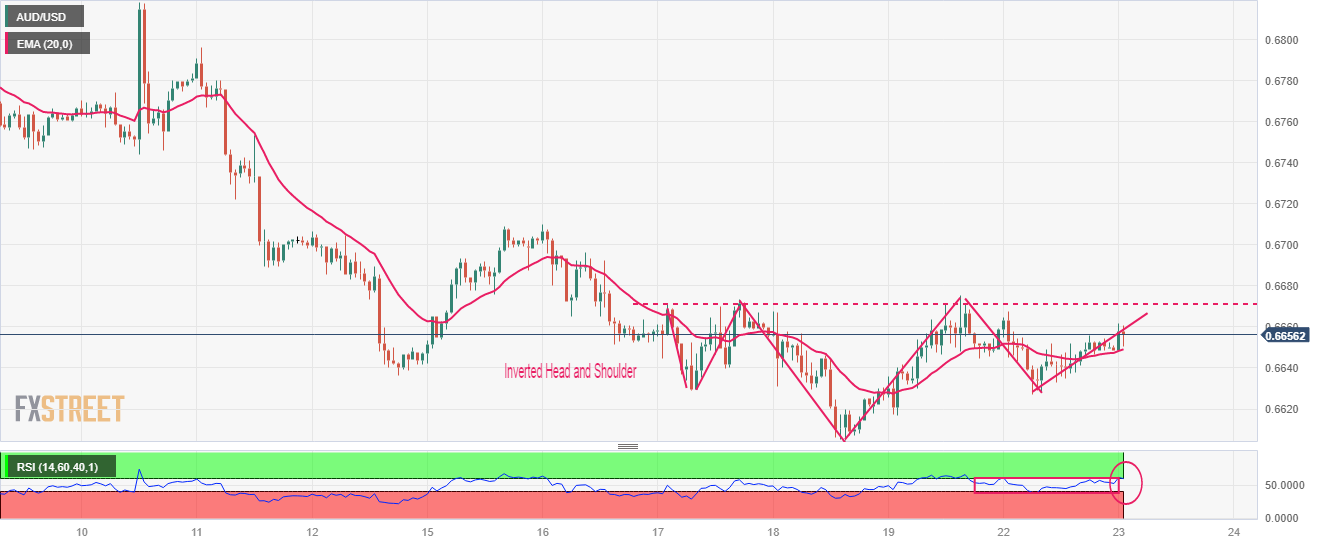
  • AUD/USD has formed an Inverted Head and Shoulder pattern, which advocates a bullish reversal after a long consolidation.

The AUD/USD pair has shown a recovery move after correcting to near 0.6650 in the Tokyo session. The Aussie asset has gained some strength despite a solid recovery in the US Dollar Index (DXY). In spite of a further delay in the US debt-ceiling negotiations, as a meeting between US President Joe Biden and House of Speaker Kevin McCarthy ended without an agreement, the USD Index has gained traction.

The release of the upbeat preliminary Australian S&P PMI (May) has infused some strength in the Australian Dollar. Manufacturing PMI has jumped to 48.0 from the expectations of 47.3 but remained in line with the former release. Also, Services PMI outperformed estimates, landed at 51.3.

The USD Index has recovered its entire losses posted in early Asia but is facing barricades in extending its rally further.

AUD/USD has formed an Inverted Head and Shoulder chart pattern on an hourly scale, which advocates a bullish reversal after a long consolidation. The Aussie asset is expected to witness a significant upside after a breakout of the neckline plotted from May 17 high at 0.6690.

The 20-period Exponential Moving Average (EMA) at 0.6650 is providing support to the Aussie bulls.

Also, the Relative Strength Index (RSI) (14) is making efforts for shifting into the bullish range of 60.00-80.00 after which a bullish momentum will get triggered.

A confident acceptance above the neckline plotted from May 17 high at 0.6690 will send the Aussie bulls firmly toward the round-level resistance at 0.6800 followed by February 06 low at 0.6855.

In an alternate scenario, US Dollar bulls will flex their muscles if the Aussie asset will drop below March 15 low at 0.6590. An occurrence of the same will expose the asset to March 08 low at 0.6568 followed by 02 November 2022 high around 0.6500.

AUD/USD hourly chart

AUD/USD

Overview
Today last price0.6655
Today Daily Change0.0003
Today Daily Change %0.05
Today daily open0.6652
 
Trends
Daily SMA200.6675
Daily SMA500.6687
Daily SMA1000.6784
Daily SMA2000.6712
 
Levels
Previous Daily High0.6668
Previous Daily Low0.6627
Previous Weekly High0.671
Previous Weekly Low0.6605
Previous Monthly High0.6806
Previous Monthly Low0.6574
Daily Fibonacci 38.2%0.6652
Daily Fibonacci 61.8%0.6643
Daily Pivot Point S10.663
Daily Pivot Point S20.6609
Daily Pivot Point S30.659
Daily Pivot Point R10.6671
Daily Pivot Point R20.6689
Daily Pivot Point R30.6711

Author

Sagar Dua

Sagar Dua

FXStreet

Sagar Dua is associated with the financial markets from his college days. Along with pursuing post-graduation in Commerce in 2014, he started his markets training with chart analysis.

More from Sagar Dua
Share:

Markets move fast. We move first.

Orange Juice Newsletter brings you expert driven insights - not headlines. Every day on your inbox.

By subscribing you agree to our Terms and conditions.

Editor's Picks

EUR/USD bounces toward 1.1750 as US Dollar loses strength

EUR/USD returned to the 1.1750 price zone in the American session on Friday, despite falling Wall Street, which indicates risk aversion. Trading conditions remain thin following the New Year holiday and ahead of the weekend, with the focus shifting to US employment and European data scheduled for next week.

GBP/USD nears 1.3500, holds within familiar levels

After testing 1.3400 on the last day of 2025, GBP/USD managed to stage a rebound. Nevertheless, the pair finds it difficult to gather momentum and trades with modest intraday gains at around 1.3490 as market participants remain in holiday mood.

Gold trims intraday gains, approaches $4,300

Gold retreated sharply from the $4,400  area and trades flat for the day in the $4,320 price zone. Choppy trading conditions exacerbated the intraday decline, although XAU/USD bearish case is out of the picture, considering growing expectations for a dovish Fed and persistent geopolitical tensions.

Cardano gains early New Year momentum, bulls target falling wedge breakout

Cardano kicks off the New Year on a positive note and is extending gains, trading above $0.36 at the time of writing on Friday. Improving on-chain and derivatives data point to growing bullish interest, while the technical outlook keeps an upside breakout in focus.

Economic outlook 2026-2027 in advanced countries: Solidity test

After a year marked by global economic resilience and ending on a note of optimism, 2026 looks promising and could be a year of solid economic performance. In our baseline scenario, we expect most of the supportive factors at work in 2025 to continue to play a role in 2026.

Crypto market outlook for 2026

Year 2025 was volatile, as crypto often is.  Among positive catalysts were favourable regulatory changes in the U.S., rise of Digital Asset Treasuries (DAT), adoption of AI and tokenization of Real-World-Assets (RWA).