|

AUD/USD Price Analysis: Rebounds from 0.6730 support confluence

  • AUD/USD prints mild gains around seven-week low, grinds near intraday high of late.
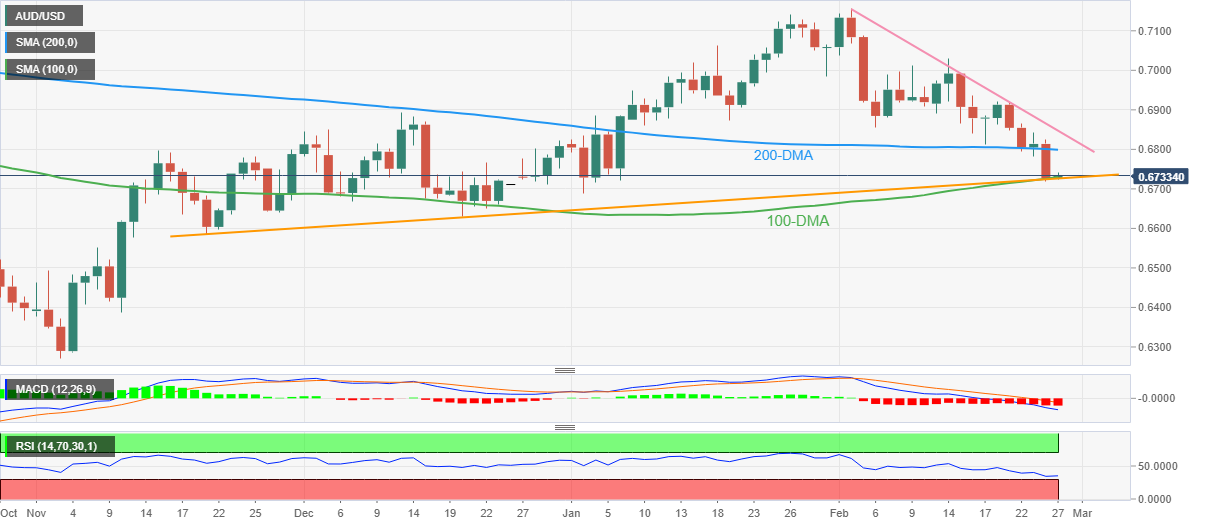
  • Convergence of 100-DMA, three-month-old ascending support line restricts immediate downside amid nearly oversold RSI conditions.
  • 200-DMA, three-week-old descending trend line challenge recovery moves amid bearish MACD signals.

AUD/USD licks its wounds while printing mild gains around 0.6735-40, bouncing off a seven-week low during early Monday’s sluggish session.

In doing so, the Aussie pair rebounds from a convergence of the 100-DMA and an upward-sloping support line from late November 2022. The corrective move also justifies the nearly oversold RSI (14).

However, the recovery remains elusive unless providing a daily closing beyond the 200-DMA hurdle of 0.6800.

Following that, a downward-sloping resistance line from February 02, close to 0.6850 at the latest, acts as the last defense of the AUD/USD bears, a break of which could propel prices towards the 0.7000 round figure.

Should the Aussie pair buyers keep the reins past 0.7000, tops marked during the mid-February, as well as the monthly high, surrounding 0.7030 and 0.7160 in that order, could lure the upside momentum.

Meanwhile, a daily closing below 0.6730 could quickly drag AUD/USD toward a late December 2022 low near 0.6630. However, lows marked during November 21 and 11, around 0.6585 and 0.6575 could challenge the bears afterward.

Overall, AUD/USD is likely to witness further downside unless marking a sustained break of 0.6850.

AUD/USD: Daily chart

Trend: Limited recovery expected

Additional important levels

Overview
Today last price0.6734
Today Daily Change0.0007
Today Daily Change %0.10%
Today daily open0.6727
 
Trends
Daily SMA200.693
Daily SMA500.6893
Daily SMA1000.6726
Daily SMA2000.6801
 
Levels
Previous Daily High0.6824
Previous Daily Low0.6719
Previous Weekly High0.6921
Previous Weekly Low0.6719
Previous Monthly High0.7143
Previous Monthly Low0.6688
Daily Fibonacci 38.2%0.6759
Daily Fibonacci 61.8%0.6784
Daily Pivot Point S10.6689
Daily Pivot Point S20.6651
Daily Pivot Point S30.6584
Daily Pivot Point R10.6795
Daily Pivot Point R20.6862
Daily Pivot Point R30.69

Author

Anil Panchal

Anil Panchal

FXStreet

Anil Panchal has nearly 15 years of experience in tracking financial markets. With a keen interest in macroeconomics, Anil aptly tracks global news/updates and stays well-informed about the global financial moves and their implications.

More from Anil Panchal
Share:

Markets move fast. We move first.

Orange Juice Newsletter brings you expert driven insights - not headlines. Every day on your inbox.

By subscribing you agree to our Terms and conditions.

Editor's Picks

EUR/USD edges above 1.1750 due to ECB-Fed policy divergence

EUR/USD has recovered its recent losses registered in the previous session, trading around 1.1760 during the Asian hours on Friday. Traders will likely observe Germany’s Manufacturing Purchasing Managers’ Index data later in the day.

GBP/USD gathers strength above 1.3450 on Fed rate cut bets, BoE's gradual policy path

The GBP/USD pair gathers strength to around 1.3480 during the early Asian session on Friday. Expectations of the US Federal Reserve rate cuts this year weigh on the US Dollar against the Pound Sterling. Philadelphia Fed President Anna Paulson is set to speak later on the weekend. 

Gold climbs to near $4,350 on Fed rate cut bets, geopolitical risks

Gold price rises to near $4,345 during the early Asian session on Friday. Gold finished 2025 with a significant rally, achieving an annual gain of around 65%, its biggest annual gain since 1979. The rally of the precious metal is bolstered by the prospect of further US interest rate cuts in 2026 and safe-haven flows.

Bitcoin, Ethereum and Ripple enter the New Year with breakout hopes

Bitcoin, Ethereum, and Ripple entered the new year trading at key technical levels on Friday, as traders seek fresh directional cues in January. With BTC locked in a tight range, ETH is approaching its 50-day Exponential Moving Average, while XRP is nearing resistance. A clear breakout across these top three cryptocurrencies could help define market momentum in the opening weeks of the year.

Economic outlook 2026-2027 in advanced countries: Solidity test

After a year marked by global economic resilience and ending on a note of optimism, 2026 looks promising and could be a year of solid economic performance. In our baseline scenario, we expect most of the supportive factors at work in 2025 to continue to play a role in 2026.

Crypto market outlook for 2026

Year 2025 was volatile, as crypto often is.  Among positive catalysts were favourable regulatory changes in the U.S., rise of Digital Asset Treasuries (DAT), adoption of AI and tokenization of Real-World-Assets (RWA).