|

AUD/USD Price Analysis: Pullback from 50-EMA highlights 0.6720 support

  • AUD/USD pares the first weekly gain in three around the lowest levels in two months.
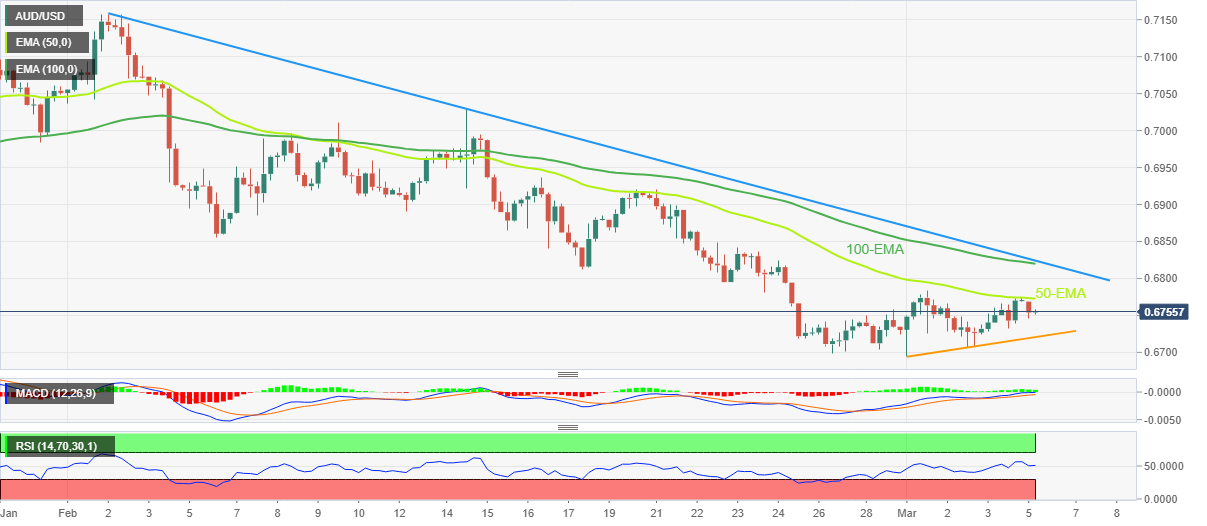
  • Convergence of 100-EMA, one-month-old descending resistance line adds to the upside filters.
  • Bullish MACD signals, RSI’s upward grind keeps pair buyers hopeful.
  • Downside break of ascending support line from Wednesday appears crucial for bear’s return.

AUD/USD prints mild losses around the mid-0.6700s as bulls take a breather following the first weekly gain in three during early Monday. In doing so, the Aussie pair portrays the failure to cross the 50-bar Exponential Moving Average (EMA).

Even so, the bullish MACD signals and the RSI (14) rebound keeps the AUD/USD buyers hopeful unless the quote breaks a three-day-old support line, around 0.6720.

Following that, the monthly low near the 0.6700 round figure and the January 2023 low of 0.6687 can act as extra checks for the Aussie pair sellers before giving them control.

Should the AUD/USD bears keep the reins past 0.6687, the last December’s bottom surrounding 0.6630 may gain the market’s attention.

On the contrary, recovery moves need to cross the 50-EMA hurdle near 0.6775 to convince intraday buyers of the AUD/UDS pair.

However, a convergence of the 100-EMA and a downward-sloping resistance line from early February, around 0.6820-25 by the press time, appears a tough nut to crack for the pair buyers.

In a case where the AUD/USD bulls manage to keep the driver’s seat past 0.6825, the odds of witnessing a run-up toward the mid-February high of near 0.7030 can’t be ruled out. It should be noted that the 0.7000 round figure may act as a buffer between 0.6825 and 0.7030.

AUD/USD: Daily chart

Trend: Limited downside expected

Additional important levels

Overview
Today last price0.6757
Today Daily Change-0.0014
Today Daily Change %-0.21%
Today daily open0.6771
 
Trends
Daily SMA200.6854
Daily SMA500.6898
Daily SMA1000.6749
Daily SMA2000.6792
 
Levels
Previous Daily High0.6775
Previous Daily Low0.6726
Previous Weekly High0.6784
Previous Weekly Low0.6695
Previous Monthly High0.7158
Previous Monthly Low0.6698
Daily Fibonacci 38.2%0.6756
Daily Fibonacci 61.8%0.6744
Daily Pivot Point S10.6739
Daily Pivot Point S20.6708
Daily Pivot Point S30.669
Daily Pivot Point R10.6788
Daily Pivot Point R20.6806
Daily Pivot Point R30.6838

Author

Anil Panchal

Anil Panchal

FXStreet

Anil Panchal has nearly 15 years of experience in tracking financial markets. With a keen interest in macroeconomics, Anil aptly tracks global news/updates and stays well-informed about the global financial moves and their implications.

More from Anil Panchal
Share:

Markets move fast. We move first.

Orange Juice Newsletter brings you expert driven insights - not headlines. Every day on your inbox.

By subscribing you agree to our Terms and conditions.

Editor's Picks

EUR/USD moves sideways below 1.1800 on Christmas Eve

EUR/USD struggles to find direction and trades in a narrow channel below 1.1800 after posting gains for two consecutive days. Bond and stock markets in the US will open at the usual time and close early on Christmas Eve, allowing the trading action to remain subdued. 

GBP/USD keeps range around 1.3500 amid quiet markets

GBP/USD keeps its range trade intact at around 1.3500 on Wednesday. The Pound Sterling holds the upper hand over the US Dollar amid pre-Christmas light trading as traders move to the sidelines heading into the holiday season. 

Gold retreats from record highs, trades below $4,500

Gold retreats after setting a new record-high above $4,520 earlier in the day and trades in a tight range below $4,500 as trading volumes thin out ahead of the Christmas break. The US Dollar selling bias remains unabated on the back of dovish Fed expectations, which continues to act as a tailwind for the bullion amid persistent geopolitical risks.

Bitcoin slips below $87,000 as ETF outflows intensify, whale participation declines

Bitcoin price continues to trade around $86,770 on Wednesday, after failing to break above the $90,000 resistance. US-listed spot ETFs record an outflow of $188.64 million on Tuesday, marking the fourth consecutive day of withdrawals.

Economic outlook 2026-2027 in advanced countries: Solidity test

After a year marked by global economic resilience and ending on a note of optimism, 2026 looks promising and could be a year of solid economic performance. In our baseline scenario, we expect most of the supportive factors at work in 2025 to continue to play a role in 2026.

Avalanche struggles near $12 as Grayscale files updated form for ETF

Avalanche trades close to $12 by press time on Wednesday, extending the nearly 2% drop from the previous day. Grayscale filed an updated form to convert its Avalanche-focused Trust into an ETF with the US Securities and Exchange Commission.