AUD/USD Price Analysis: Consolidates below 0.7800 after the triangle breakout
- AUD/USD’s rally to 0.7800 takes a breather as DXY bounces.
- The aussie holds upside after descending triangle breakout on the 1D chart.
- Strong support is seen at 0.7768, key confluence area.

AUD/USD is off the weekly highs, consolidating below 0.7800 amid a broad rebound staged by the US dollar in the European session.
The advance in gold above $1900 combined with the hawkish RBNZ decision-led Kiwi rally underpins the sentiment around the aussie.
Looking ahead, the US dollar price action could help determine whether the spot will recapture the 0.7800 mark. Fedspeak will remain in focus amid an absence of relevant first-tier US economic data.
From a near-term technical perspective, the spot extended its rally on a break above the falling trendline resistance at 0.7770.
The descending triangle breakout got confirmed after the price settled above the latter on a four-hour candlestick closing basis.
The risks remain tilted to the upside for the major, as the pattern target measured at 0.7879 remains on the buyers’ radars.
However, the 0.7800 needs to be cracked on a sustained basis to unleash additional gains.
The Relative Strength Index (RSI) has turned south while holding above the midline, suggesting the latest leg down in the prices.
AUD/USD four-hour chart
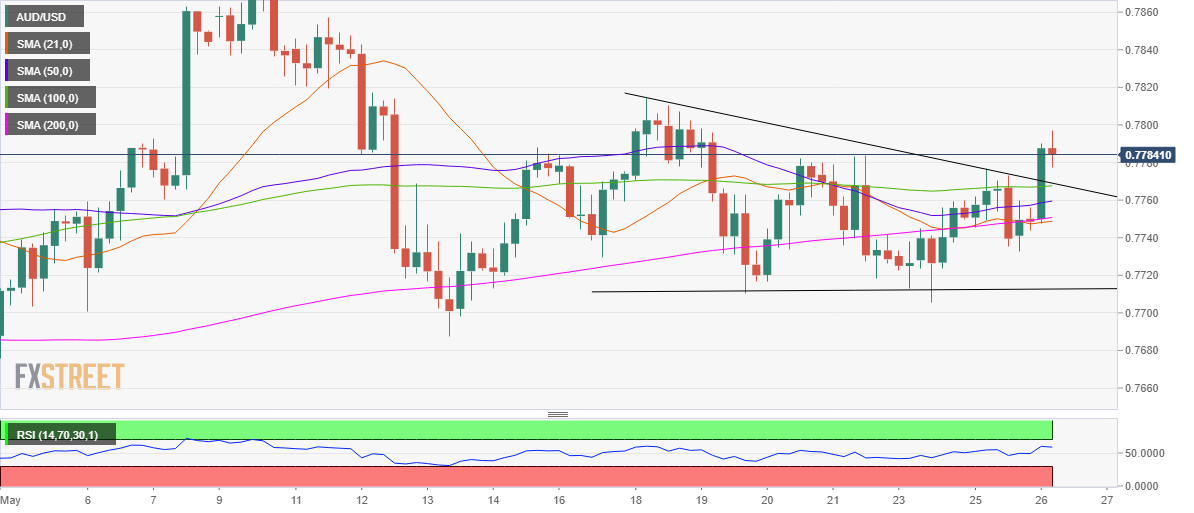
If the retracement picks up pace, the confluence of the triangle resistance and the horizontal 100-simple moving average (SMA) at 0.7770 could come to the rescue of the AUD bulls.
Further south, the 100-SMA resistance turned support at 0.7759 could be put to test.
AUD/USD additional levels to watch
Author

Dhwani Mehta
FXStreet
Residing in Mumbai (India), Dhwani is a Senior Analyst and Manager of the Asian session at FXStreet. She has over 10 years of experience in analyzing and covering the global financial markets, with specialization in Forex and commodities markets.
















