|

AUD/USD Price Analysis: Bulls cheer 0.6770 breakout at 11-week high

  • AUD/USD grinds higher after refreshing multi-day top, firmer during three-day uptrend.
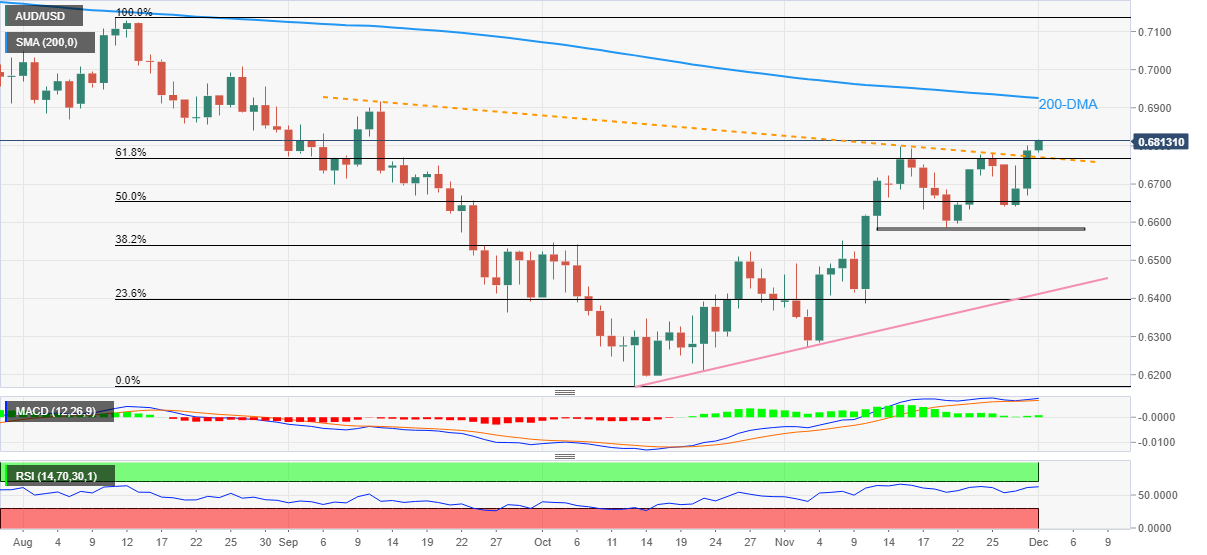
  • Convergence of previous resistance line, 61.8% Fibonacci retracement restricts downside.
  • September’s high, 200-DMA lure buyers amid firmer oscillators.

AUD/USD juggles around 0.6810 heading into Thursday’s European session, after rising to the highest levels since September 13 earlier in the day.

That said, the Aussie pair prints a three-day uptrend as bulls cheer the previous day’s run-up beyond the downward-sloping resistance line from the mid-September, as well as the 61.8% Fibonacci retracement level of the pair’s August-October upside, surrounding 0.6770.

Also keeping the buyers hopeful are the bullish MACD signals and the firmer RSI (14), not overbought.

As a result, the AUD/USD bulls are on the way to approaching the next key hurdle to the north, namely September’s high surrounding 0.6915.

However, the RSI line is near the overbought conditions and may challenge the bull’s upside past 0.6915, if not then the 200-DMA resistance of 0.6925 could restrict the Aussie pair’s further advances.

Meanwhile, a downside break of the 0.6770 support confluence isn’t an open welcome to the AUD/USD bears as a three-week-old horizontal support zone near 0.6580 could restrict the pair’s further declines.

In a case where the quote drops below 0.6580, an ascending trend line from October 13, near 0.6410 acts as the last defense of the bulls.

AUD/USD: Daily chart

Trend: Further upside expected

Additional important levels

Overview
Today last price0.6808
Today Daily Change0.0020
Today Daily Change %0.29%
Today daily open0.6788
 
Trends
Daily SMA200.6634
Daily SMA500.6491
Daily SMA1000.6687
Daily SMA2000.6928
 
Levels
Previous Daily High0.6801
Previous Daily Low0.667
Previous Weekly High0.6781
Previous Weekly Low0.6585
Previous Monthly High0.6801
Previous Monthly Low0.6272
Daily Fibonacci 38.2%0.6751
Daily Fibonacci 61.8%0.672
Daily Pivot Point S10.6705
Daily Pivot Point S20.6622
Daily Pivot Point S30.6575
Daily Pivot Point R10.6836
Daily Pivot Point R20.6884
Daily Pivot Point R30.6966

Author

Anil Panchal

Anil Panchal

FXStreet

Anil Panchal has nearly 15 years of experience in tracking financial markets. With a keen interest in macroeconomics, Anil aptly tracks global news/updates and stays well-informed about the global financial moves and their implications.

More from Anil Panchal
Share:

Editor's Picks

EUR/USD flirts with weekly lows near 1.1770

EUR/USD now comes under further selling pressure, breaking below the 1.1800 support to challenge the area of weekly throughs near 1.1770 on Thursday. The pair’s decline comes in response to marked gains in the US Dollar amid steady geopolitical tensions. Ealier in the day, the ECB’s Lagarde delivered cautious remarks, although the currency remained apathetic.

GBP/USD threatens the 200-day SMA near 1.3440

GBP/USD rapidly leaves behind Wednesday’s strong advance, coming under heavy pressure and retesting the 1.3440 zone, where the critical 200-day SMA is located. Cable’s deep pullback follows the strong gains in the Greenback, while investors continue to pencil in a potential BoE rate cut in March.

Gold trims gains, slips back to around $5,170

Gold is now facing some downside pressure, hovering around the $5,170 region on Thursday. The yellow metal surrenders part of its earlier gains on the back of the resurgence of the buying interest in the Greenback. In the meantime, geopolitical tensions in the Middle East continue to limit the downside potential for now.

Stellar: Relief bounce fades as bearish undertone persists

Stellar is trading around $0.16 at the time of writing on Thursday after rebounding more than 8% in the previous day. Derivatives data paints a negative picture as XLM’s short bets hit a monthly high while Open Interest continues to decline.

Changing the game: International implications of recent tariff developments

The Supreme Court ruling on International Emergency Economic Powers Act (IEEPA) tariffs provides limited relief for the rest of the world, with weighted average tariff rates modestly lower.

Bitcoin steadies as traders eye US–Iran talks

Bitcoin (BTC) price is stabilizing around $68,000 at the time of writing on Thursday after a 6.2% relief rally the previous day amid a broader downward trend.