|

AUD/USD Price Analysis: Bulls battle with 20-EMA around 0.6650

  • Bulls are hopeful amid a significant recovery in the risk-on impulse.
  • The DXY is expected to remain on the tenterhooks ahead of the Fed minutes release.
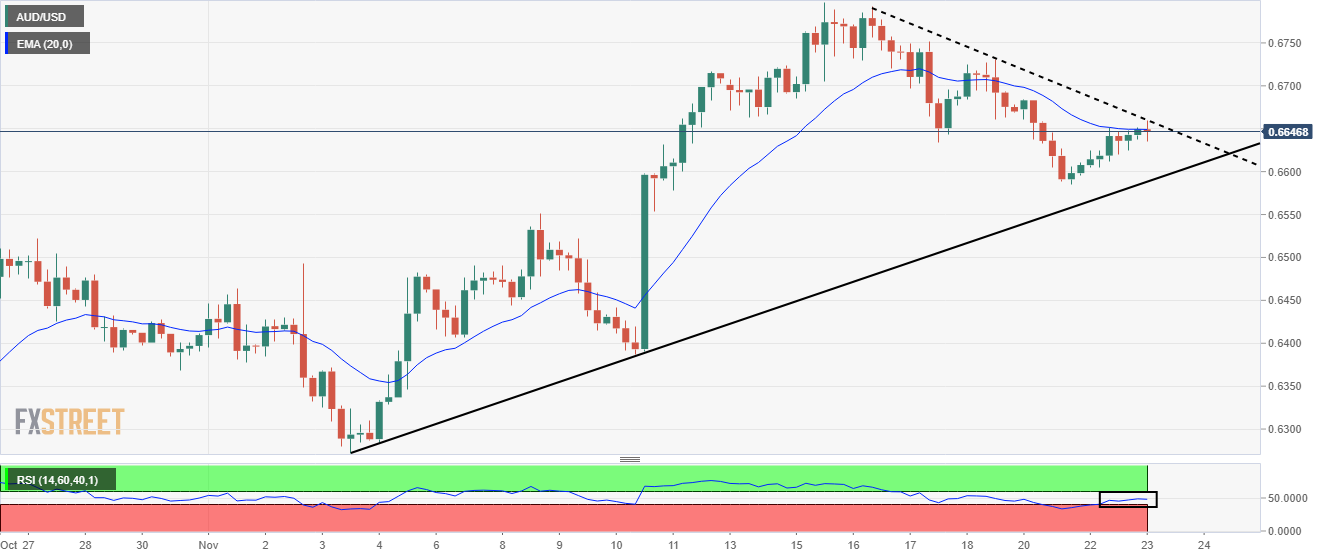
  • The RSI (14) is oscillating in a 40.00-60.00 range, which indicates a consolidation ahead.

The AUD/USD pair has witnessed a firmer rebound after a minor correction to near 0.6636 in the Tokyo session. The asset is gaining strength as the U dollar index (DXY) is on the verge of testing the 107.00 support amid optimism in the global markets.

Meanwhile, the 10-year US Treasury yields have dropped below 3.76% amid anxiety ahead of the release of the Federal Open Market Committee (FOMC) minutes. This will provide a detailed reasoning behind the announcement of the fourth consecutive 75 basis points (bps) rate hike.

On a four-hour scale, the asset has displayed a mean reversion to the 20-period Exponential Moving Average (EMA) at around 0.6650. The major could display a rangebound structure as the upside is capped by the downward-sloping trendline placed from November 16 high at 0.6793 while the downside is supported by the upward-sloping trendline plotted from November’s low at 0.6272.

The Relative Strength Index (RSI) (14) has shifted into the 40.00-60.00 range, which indicates a consolidation ahead.

Should the asset oversteps Monday’s high at 0.6685, Aussie bulls will get strengthened and will drive the asset towards November 17 high at 0.6751, followed by November’s high around 0.6800.

On the contrary, the Greenback bulls could be supported if the asset surrenders Monday’s low at 0.6585. This will drag the asset towards November 8 high and low at 0.6551 and 0.6444 respectively.

AUD/USD four-hour chart
AUD/USD

Overview
Today last price0.6644
Today Daily Change-0.0002
Today Daily Change %-0.03
Today daily open0.6646
 
Trends
Daily SMA200.6541
Daily SMA500.6487
Daily SMA1000.6691
Daily SMA2000.6942
 
Levels
Previous Daily High0.6652
Previous Daily Low0.6596
Previous Weekly High0.6798
Previous Weekly Low0.6634
Previous Monthly High0.6548
Previous Monthly Low0.617
Daily Fibonacci 38.2%0.663
Daily Fibonacci 61.8%0.6618
Daily Pivot Point S10.6611
Daily Pivot Point S20.6576
Daily Pivot Point S30.6556
Daily Pivot Point R10.6666
Daily Pivot Point R20.6686
Daily Pivot Point R30.6721

Author

Sagar Dua

Sagar Dua

FXStreet

Sagar Dua is associated with the financial markets from his college days. Along with pursuing post-graduation in Commerce in 2014, he started his markets training with chart analysis.


More from Sagar Dua
Share:

Editor's Picks

GBP/USD retreats below 1.3450; Fed Minutes in focus

GBP/USD struggles to find its footing and edges lower in the European session, pressured by the renewed USD strength. US President Donald Trump said on the MoU signed with Iran to end the conflict was "over", causing safe-haven flows to dominate the action in financial markets and boosting. Later in the American session, the Fed will publish the minutes of the June policy meeting.

EUR/USD falls toward 1.1400 as USD gathers strength on Trump comments

EUR/USD comes under bearish pressure in the European session and declines toward 1.1400. US President Trump said the MoU signed with Iran to end the conflict was "over" and added that the didn't want to engage with Tehran anymore, triggering a flight-to-safety and boosting the USD.

Gold drops below $4,100 as Middle East tensions escalate

Gold turns south in the European session on Wednesday and trades deep in negative territory below $4,100. Investors adopt a cautious stance after US President Trump said at the NATO summit that the MoU signed with Iran to end the conflict was "over" and added he didn't want to engage with Tehran.

Pi Network crashes to a record low amid broader market stress

Pi Network (PI) price edges toward $0.1000 extending losses for the fifth straight day. Retail sentiment remains bearish as Open Interest and the funding rate decline. The technical outlook for PI is bearish as selling pressure mounts, despite oversold conditions.

WTI surges above $74 as Trump confirms MoU with Iran is over

West Texas Intermediate (WTI) soars 3.2% to near $74.30 during the European trading session, the highest level seen in two weeks. The oil price surges as the confirmation, from the US President Donald Trump that the MoU with Iran is over, has revived risks of global energy supply disruption.

Bye, forward guidance: How to trade when central banks choose silence

Central banks have spent years telling markets what might come next. Now, traders face the possibility that they say a lot less. From the Federal Reserve to the European Central Bank and the Bank of England, policymakers are pushing back against forward guidance.















