AUD/USD Price Analysis: Bears seeking a 38.2% Fibo retracement
- AUD/USD bulls seeking an upside continuation may need to be patient.
- The daily chart is offering a bearish formation and eyes are on the prior resistance.

AUD/USD is on the front foot as the US dollar takes a knock on the Nonfarm Payrolls disappointment. However, the technical outlook argues the case for a correction according to the daily chart.
The following is a top-down analysis that illustrates the bullish case from a monthly and weekly perspective and the bearish bias from a daily point of view.
Monthly chart
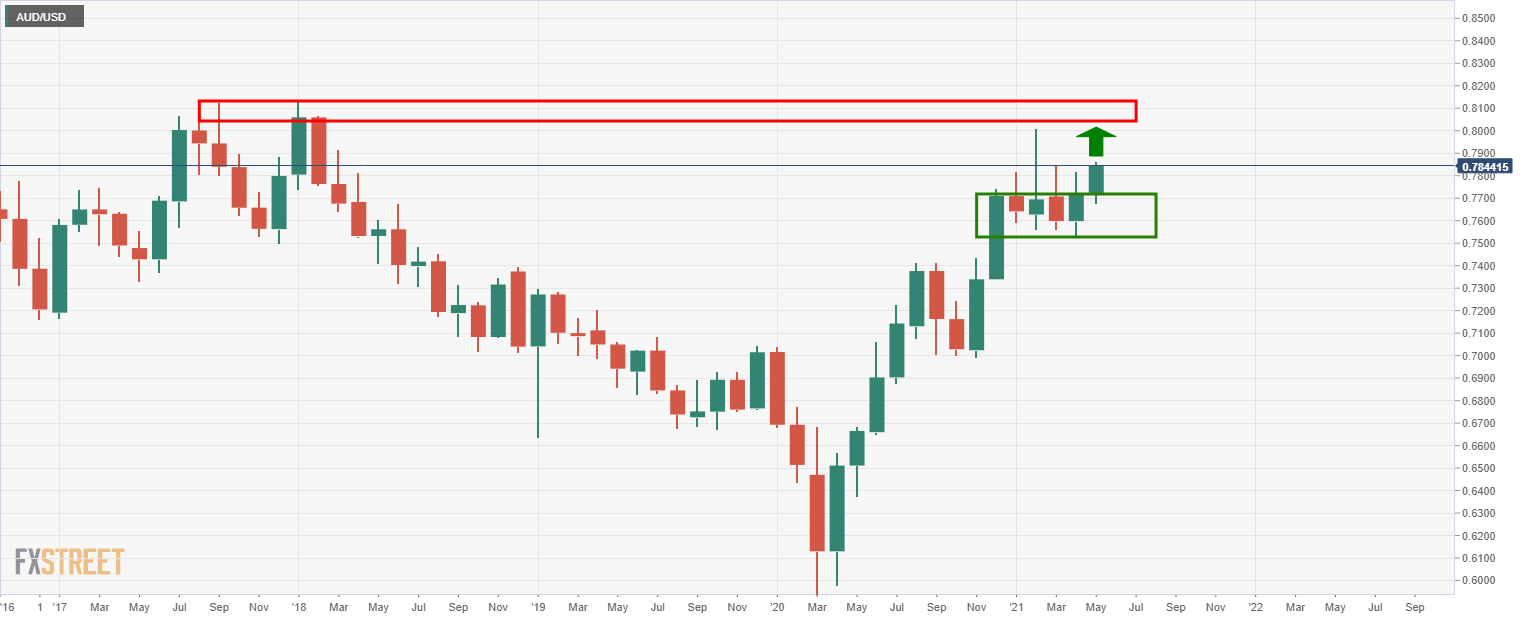
The price has rallied this month so far and is showing prospects of a continuation towards the resistance structure.
Weekly chart

The weekly chart shows a bullish reverse head and shoulders as the price it pressures the neckline.
Daily chart
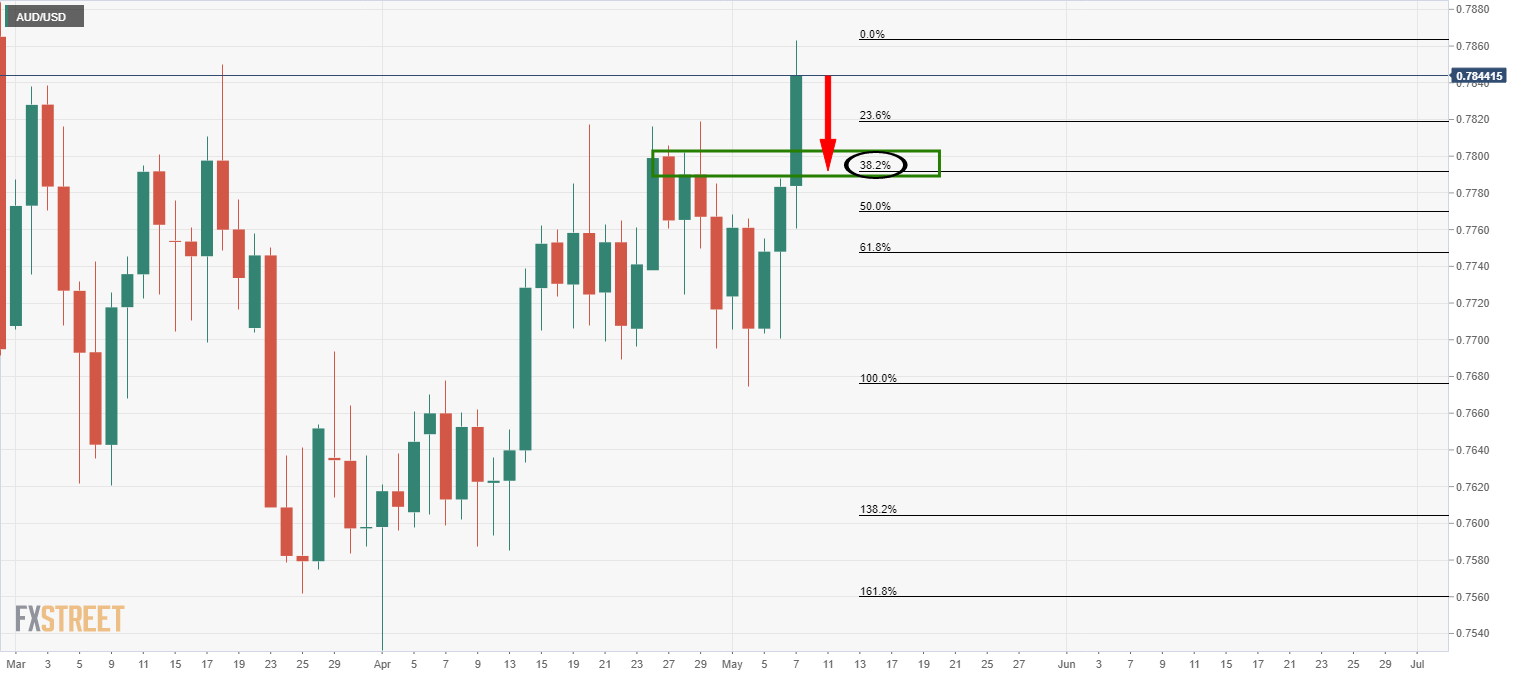
The daily chart, however, is looking overstretched and the W-formation is a bearish pattern where the price would be expected to test the prior resistance and the confluence of the 38.2% Fibonacci retracement.
Author

Ross J Burland
FXStreet
Ross J Burland, born in England, UK, is a sportsman at heart. He played Rugby and Judo for his county, Kent and the South East of England Rugby team.


