AUD/USD Price Analysis: Bears push to the edge of the abyss, looking over it to
- AUD/USD bulls eye the channel top near 0.6450 on a break of the 38.2% Fibonacci and 50% mean reversion area near 0.6380/0.6400.
- AUD/USD bears are moving the price towards the edge of the abyss and 0.6350.

AUD/USD has opened at support but hangs over the edge of the abyss at 0.6350 which guards the risk of a fall to 0.6150 for the week (s) ahead. The US dollar is on the march, supported by strong yields and the Federal Reserve's campaign to hike rates following Friday's strong US Nonfarm Payrolls data.
Speculators' net long positioning on the US dollar fell in the latest week to the lowest since mid-March, according to calculations by Reuters and U.S. Commodity Futures Trading Commission data released on Friday. This leaves scope for a reaccumulation of those positions that could add pressure to AUS/USD. The value of the net long dollar position slid to $9.44 billion in the week ended Oct. 4, from $10.43 billion the previous week, CFTC data showed.
The following illustrates both the bullish and bearish scenarios for days ahead with a strong bias to the downside longer term:
AUD/USD weekly charts
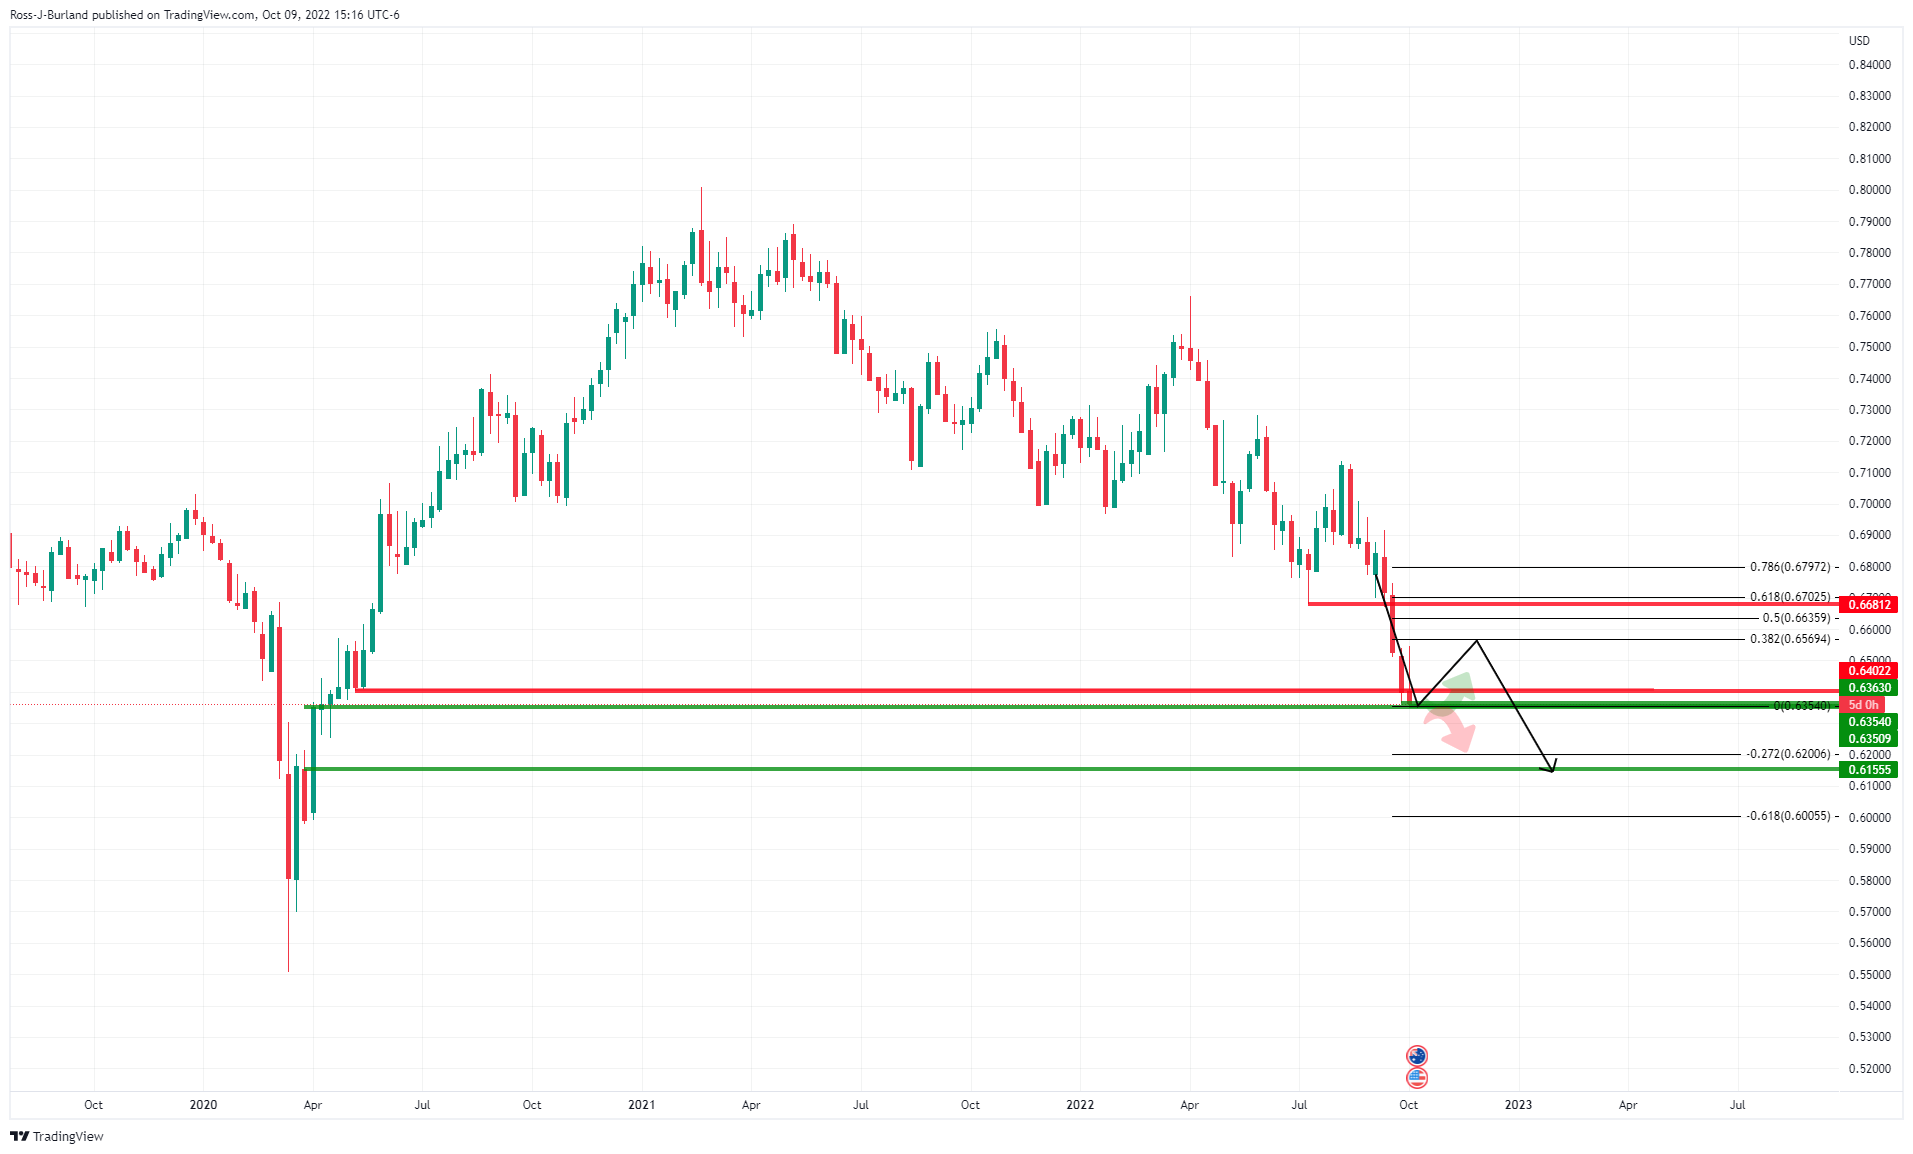
While there are prospects of a retracement of the weekly downtrend, the broader trend is lower. The Fibonacci scale can be drawn to look for confluences with structure. In this regard, the 61.8% aligns with the July lows near 0.6700. However, should the dollar remain strong, that will be a tall order to achieve.
AUD/USD daily chart
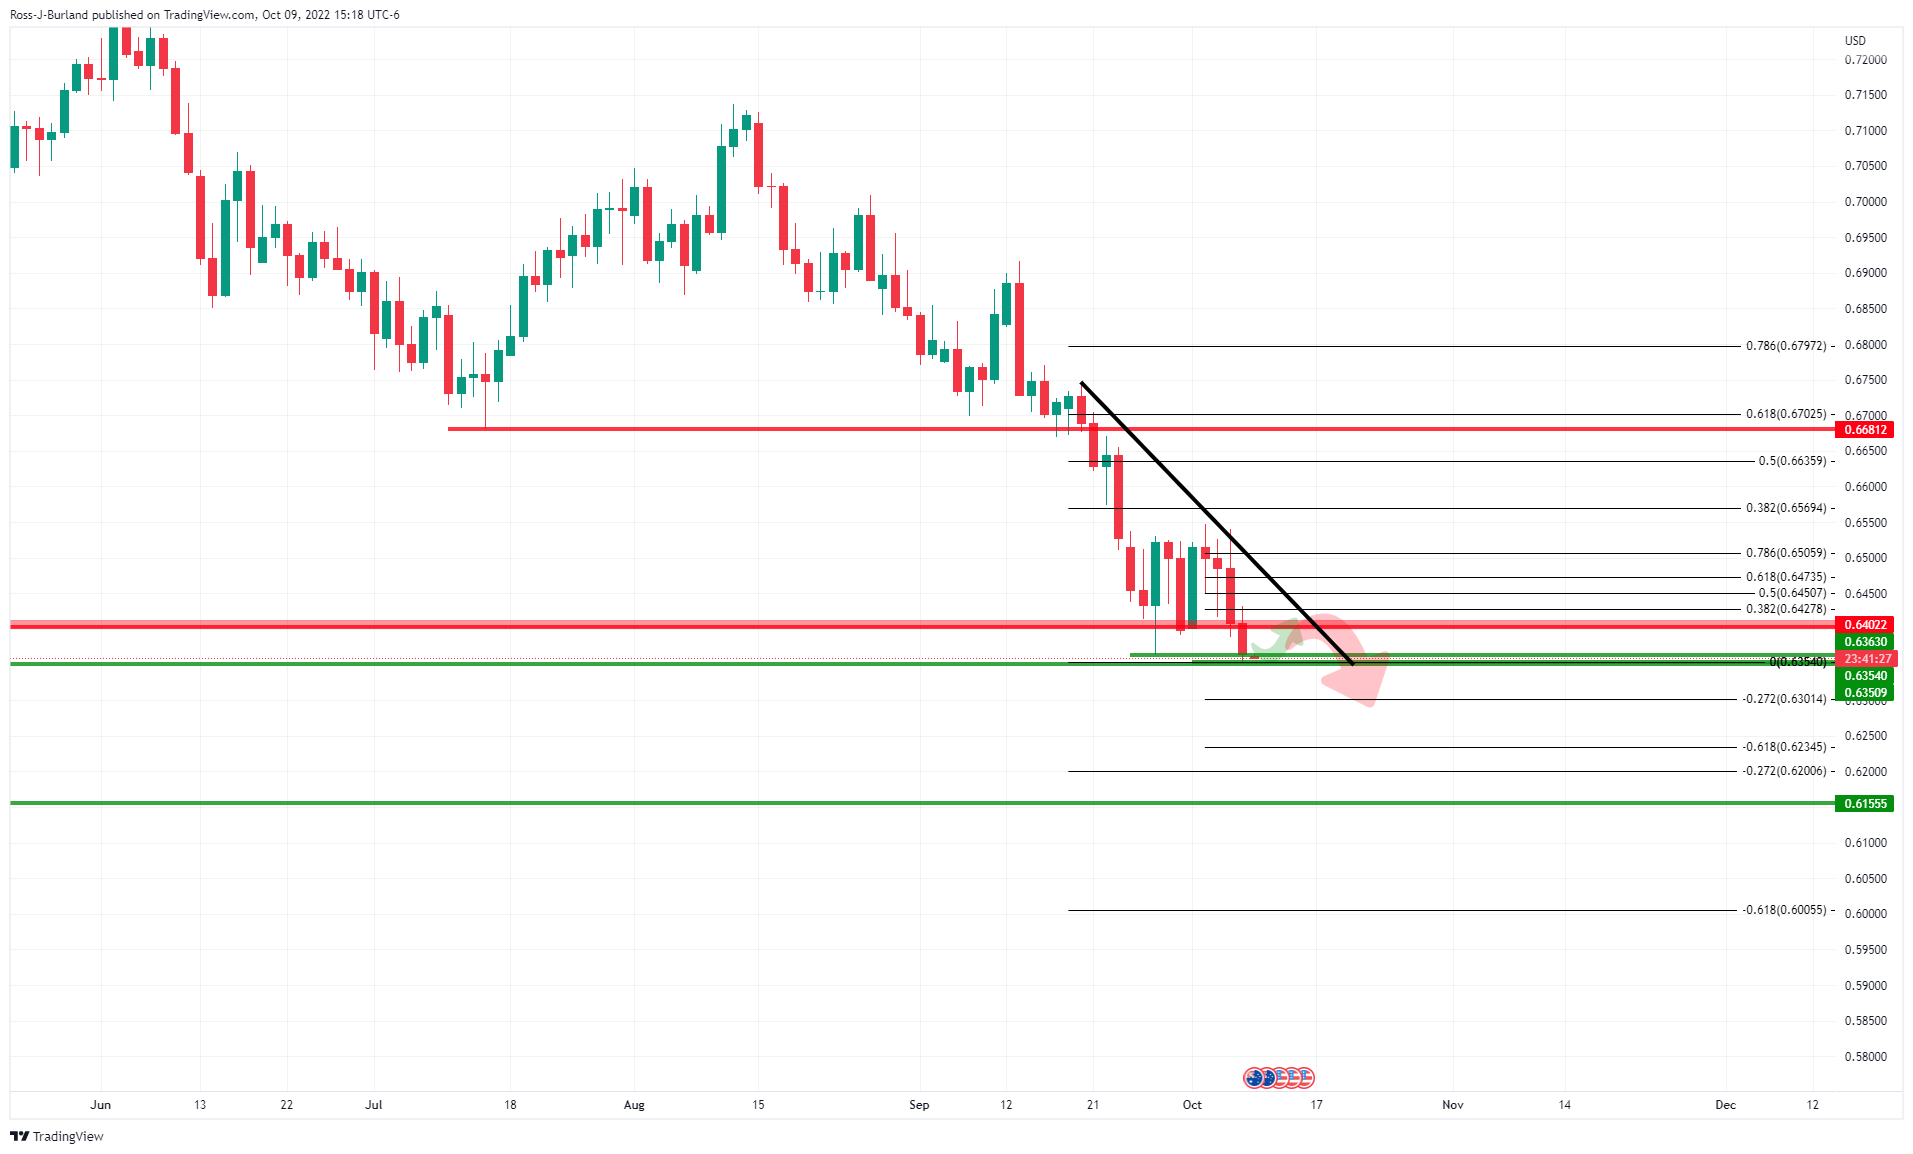
Moreover, the bulls will first need to overcome the daily resistance near 0.6550.
AUD/USD H4 chart
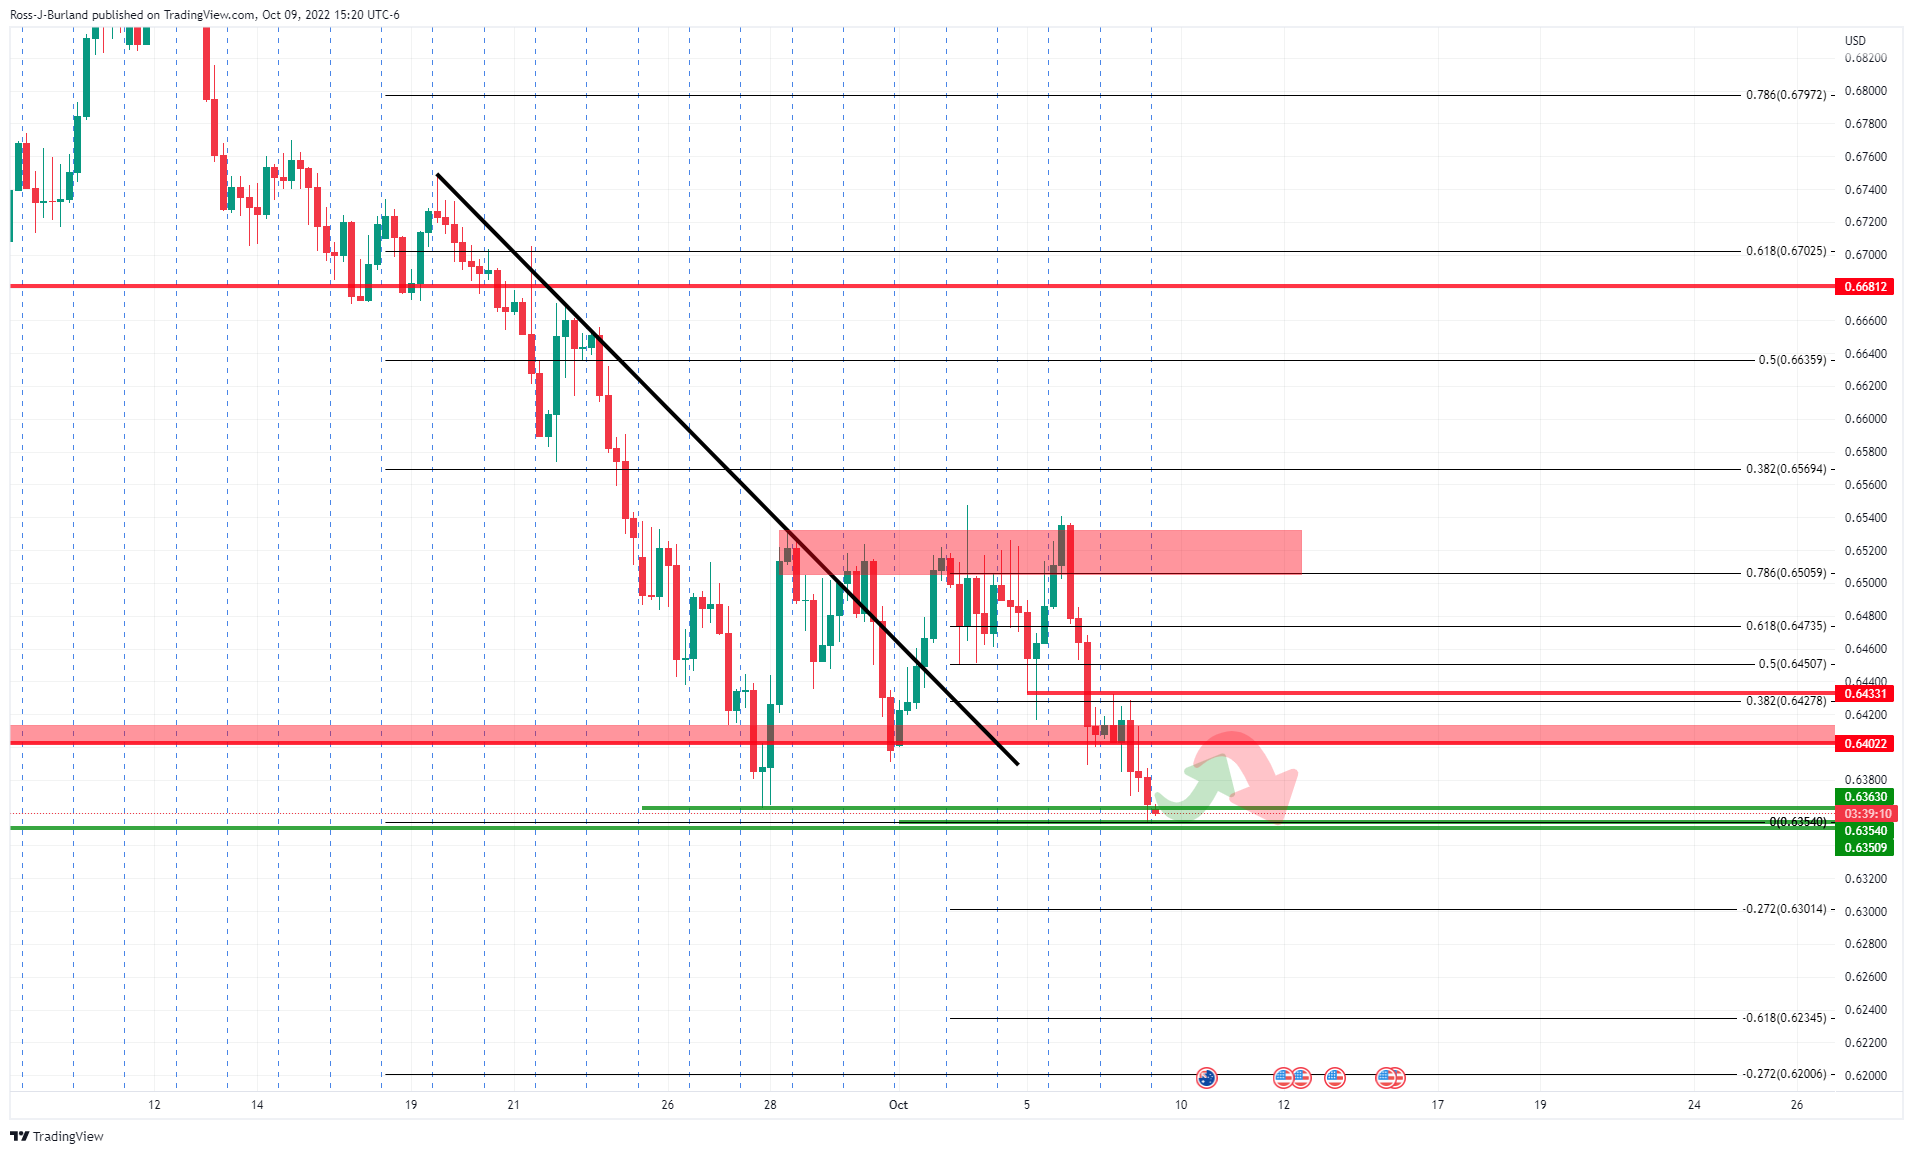
On the 4-hour time frame, the price has slid beyond the trendline resistance but is failing to hold convincingly within the channel. Nevertheless, bulls could be attracted at this stage for a discount so long as the support structure holds and the price can form a build-up of bullish candles for traders to lean into.
AUD/USD H1 chart
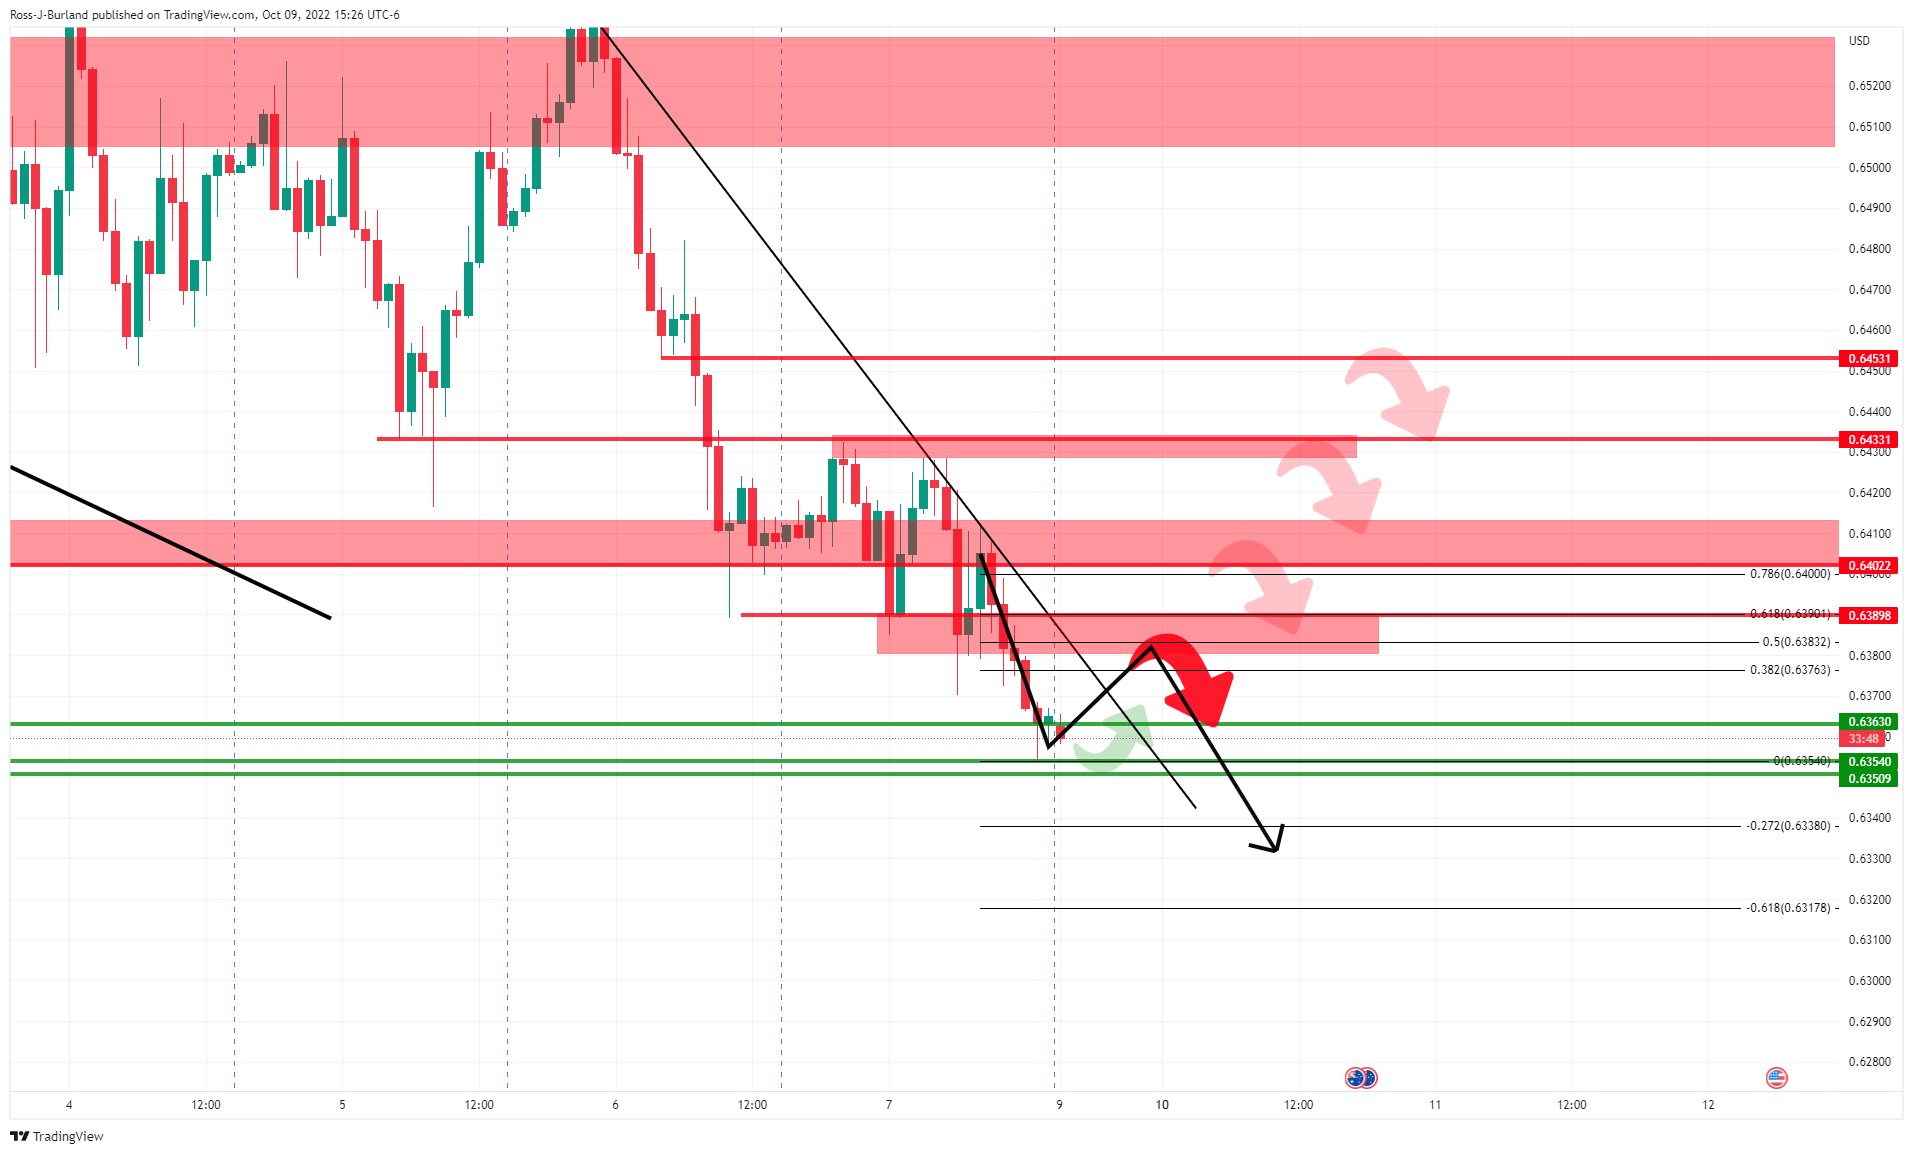
If the bulls do overcome the bears, there will be potentially strong resistance on the way up, as signified by the bearish arrows at key structural points along the way to the midpoint of the channel near 0.6450. This first hurdle comes at the confluence of the 38.2% Fibonacci and 50% mean reversion area near 0.6380/0.6400. A break there could be the most significant as it will open the way to higher levels.
Author

Ross J Burland
FXStreet
Ross J Burland, born in England, UK, is a sportsman at heart. He played Rugby and Judo for his county, Kent and the South East of England Rugby team.


