|

AUD/USD Price Analysis: Bears looking to seize control near 0.7700 mark

  • AUD/USD added to the US CPI-inspired losses and dropped to over one-week-lows on Thursday.
  • Acceptance below an important confluence support has set the stage for additional weakness.
  • A sustained move back above the 0.7800 mark is needed to negate the near-term negative bias.

The AUD/USD pair dropped to one-and-half-week lows during the first half of the European session, with bears now looking to extend the downward momentum further below the 0.7700 mark.

The pair struggled to capitalize on its modest intraday gains to the 0.7745 area, instead met with some fresh supply and was being pressured by a combination of factors. This marked the third day of a negative move in the previous four and pulled the AUD/USD pair away from the highest level since February 25, around the 0.7890 region touched earlier this week.

Following a brief consolidation, the US dollar regained positive traction and built on the previous day's hotter-than-expected US CPI-inspired gains. The prevalent risk-off environment – as depicted by an extended selloff in the global equity markets – underpinned the greenback's relative safe-haven status and drove flows away from the perceived riskier aussie.

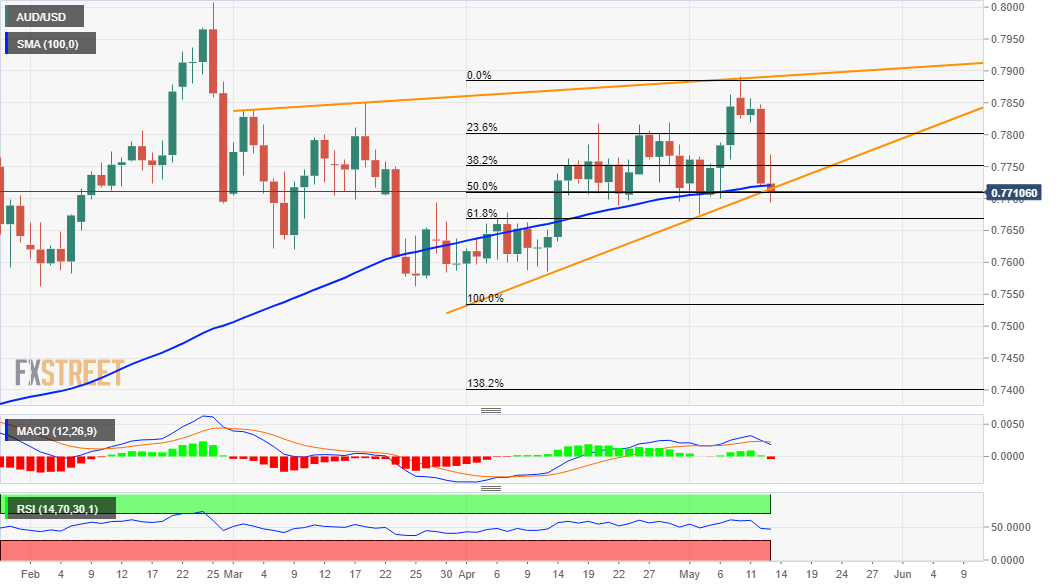
From a technical perspective, the latest leg down dragged the AUD/USD pair below confluence support – comprising of 100-day SMA, 50% Fibonacci level of the 0.7531-0.7890 positive move and an upward sloping trend-line. The latter, along with another ascending trend-line, constituted the formation of a bearish rising wedge pattern on the daily chart.

Meanwhile, technical indicators on the daily chart have just started drifting into the negative territory. Hence, some follow-through selling will mark a near-term bearish breakdown and accelerate the slide to the 61.8% Fibo. level, around the 0.7670 region. The AUD/USD pair might then turn vulnerable to slide further towards testing the 0.7600 mark.

On the flip side, the daily swing highs, around the 0.7745 region, nearing the 38.2% Fibo. level now seems to act as an immediate strong hurdle. A sustained move beyond should allow bulls to aim back to reclaim the 0.7800 mark. The mentioned handle coincides with the 23.6% Fibo. level, which if cleared should pave the way for additional gains for the AUD/USD pair.

AUD/USD daily chart

fxsoriginal

Technical levels to watch

AUD/USD

Overview
Today last price0.7707
Today Daily Change-0.0017
Today Daily Change %-0.22
Today daily open0.7724
 
Trends
Daily SMA200.7762
Daily SMA500.771
Daily SMA1000.7719
Daily SMA2000.7489
 
Levels
Previous Daily High0.7847
Previous Daily Low0.7718
Previous Weekly High0.7863
Previous Weekly Low0.7674
Previous Monthly High0.7819
Previous Monthly Low0.7531
Daily Fibonacci 38.2%0.7768
Daily Fibonacci 61.8%0.7798
Daily Pivot Point S10.7679
Daily Pivot Point S20.7634
Daily Pivot Point S30.755
Daily Pivot Point R10.7808
Daily Pivot Point R20.7892
Daily Pivot Point R30.7937

Author

Haresh Menghani

Haresh Menghani is a detail-oriented professional with 10+ years of extensive experience in analysing the global financial markets.

More from Haresh Menghani
Share:

Editor's Picks

GBP/USD bounces off lows, back above 1.3200

After bottoming out near 1.3160, GBP/USD manages to regain a bit of shine and reclaim the 1.3200 mark and beyond at the end of the week. Stronger-than-expected UK Retail Sales data seem to be helping the British Pound limit its losses, while the chaotic UK political environment keeps the bulls at bay for now.

EUR/USD looks consolidative around 1.1460

EUR/USD stages a modest rebound after slipping to a three-month low below 1.1420 at the end of the week. That said, the pair now looks to consolidate humble gains just above 1.1460 despite growing uncertainty surrounding the next round of US-Iran negotiations, which keeps the US Dollar’s downside contained.

Gold slips back to six-day lows, targets $4,100

Gold retreats for the third consecutive day on Friday, eroding gains seen in the first half of the week and approaching the key $4,100 mark per troy ounce. Indeed, the precious metal continues to face headwinds from the Fed's hawkish stance and renewed uncertainty surrounding the next round of US-Iran negotiations.

Solana extends correction despite ETF inflows, RWA adoption

Solana (SOL) price edges below $70 extending its losses for the fourth straight day this week. The institutional demand for Solana is building, with steady inflows so far this week and Morgan Stanley’s amended S-1 filing for a Solana-focused Exchange-Traded Fund.

The Iran war didn't break the US economy, but what happens next?

Nearly four months after the start of the Iran war, the US economy remains remarkably resilient. While the conflict initially triggered a severe disruption to global energy markets and a sharp rise in Oil prices, recent diplomatic progress between Washington and Tehran has eased concerns about a prolonged supply shock.

Regime change: Inside Kevin Warsh's first move to make the Fed unreadable on purpose

The rate did not move. That was the least interesting thing about Kevin Warsh's first meeting in charge of the Fed. The FOMC held its benchmark at 3.50%-3.75% for the fourth straight meeting, exactly as priced, and then the new chair used his first press conference to dismantle the machinery the market has leaned on for a decade.