|

AUD/USD Price Analysis: At cross-roads below key 200-DMA

  • AUD/USD ends week down 0.33%, unable to hold above 0.6600, range-bound.
  • Struggle to sustain gains above 200-DMA (0.6576); potential for upward trend watched closely.
  • Key supports at 0.6551, 0.6524; rebound above 200-DMA may aim for resistances at 0.6620, 0.6652.

The AUD/USD finished Friday’s session on the back foot, down more than 0.15%, for a total of 0.33% losses in the week. At the time of writing, the pair ended at 0.6573, failing to stay above the 0.6600 figure, which exacerbated the Aussie’s drop below the key 200-day moving average (DMA).

The pair extended its sideways trading, with buyers failing to cling to the 200-DMA at 0.6576, though it seems they remain in charge. This following January’s 17 dip toward 0.6524, with the par extending its gains toward the 0.6550/0.6600 range, still unable to decisively crack the 0.6600 mark and opening the door for a pull back.

With that said, key support levels lie below the exchange rate, with the January 23 daily low of 0.6551, ahead of the January 17 swing low of 0.6524. if the pair slides below this key support level, the buyers' last line of defense would be the 0.6500 figure before diving to the November 17, 2023, low of 0.6452.

On the positive side, if buyers reclaim the 200-DMA, they could extend its rally past the 0.6600 figure toward January’s 24 high at 0.6620. The next supply zone emerges at the 50-DMA at 0.6652.

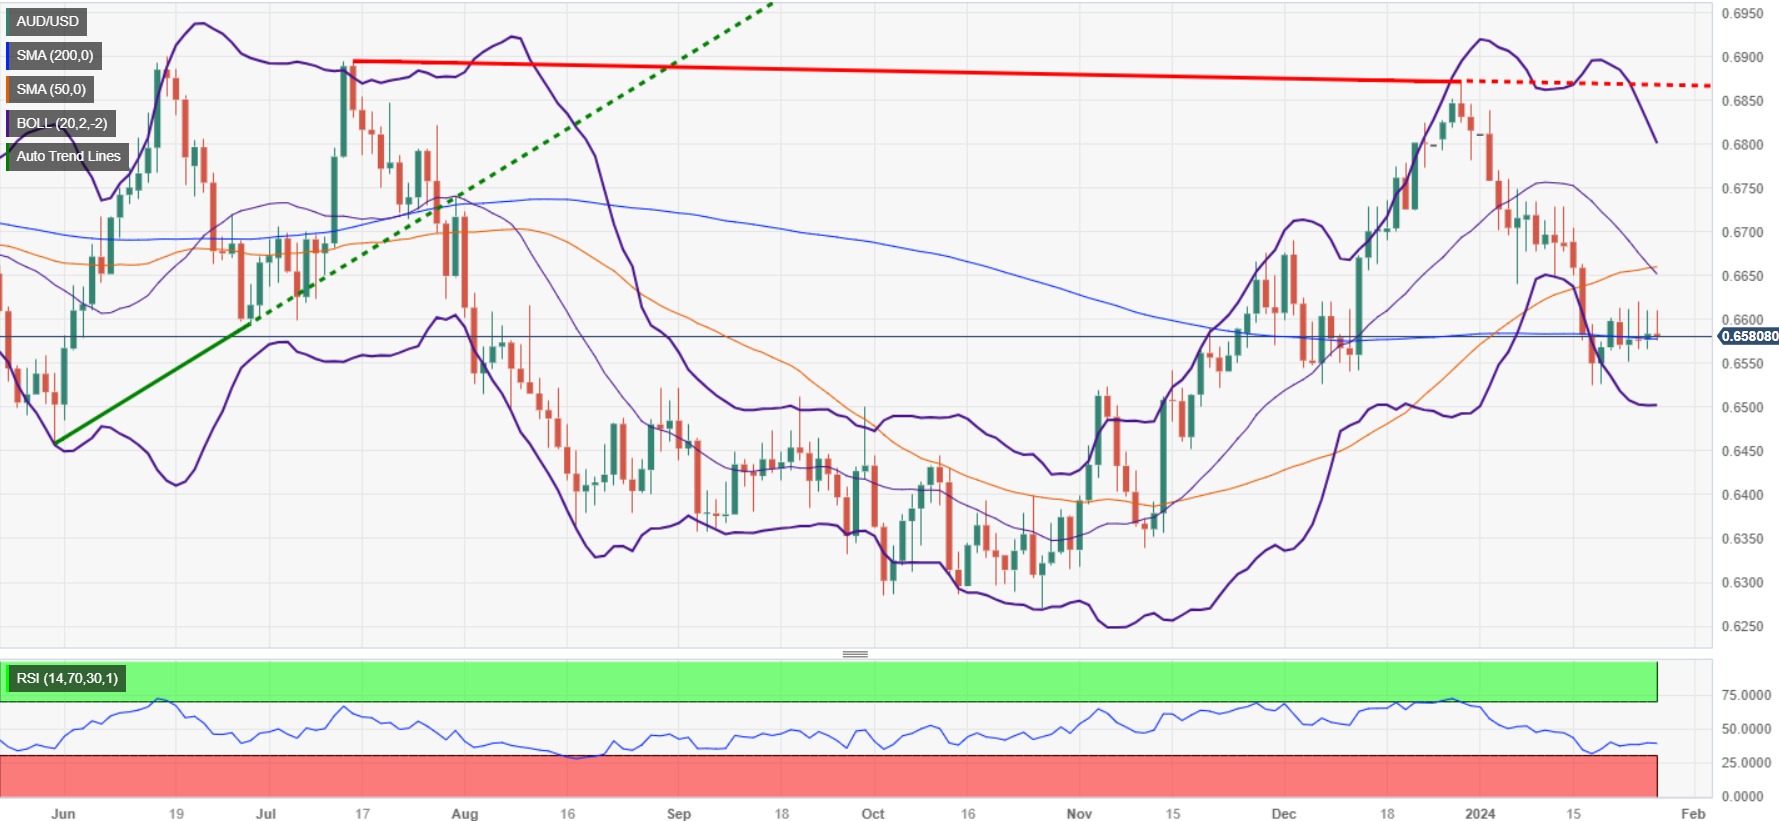
AUD/USD Price Action – Daily Chart

AUD/USD Key Levels

AUD/USD

Overview
Today last price0.6581
Today Daily Change-0.0003
Today Daily Change %-0.05
Today daily open0.6584
 
Trends
Daily SMA200.6663
Daily SMA500.6659
Daily SMA1000.6526
Daily SMA2000.6578
 
Levels
Previous Daily High0.661
Previous Daily Low0.6566
Previous Weekly High0.6705
Previous Weekly Low0.6525
Previous Monthly High0.6871
Previous Monthly Low0.6526
Daily Fibonacci 38.2%0.6593
Daily Fibonacci 61.8%0.6583
Daily Pivot Point S10.6563
Daily Pivot Point S20.6543
Daily Pivot Point S30.6519
Daily Pivot Point R10.6607
Daily Pivot Point R20.663
Daily Pivot Point R30.6651

Author

Christian Borjon Valencia

Markets analyst, news editor, and trading instructor with over 14 years of experience across FX, commodities, US equity indices, and global macro markets.

More from Christian Borjon Valencia
Share:

Editor's Picks

AUD/USD falls to near 0.7100 after slipping below 50-day EMA

AUD/USD depreciates after registering minor gains in the previous day, trading around 0.7120 during the Asian hours. The technical analysis of the daily chart shows the pair consolidating sideways within a rectangle pattern, as neither bulls nor bears gain control. The AUD/USD pair is holding a slight bearish tone however as it sits beneath both the nine-day and 50-day EMAs.

Japanese Yen edges up but remains close to the 160.00 intervention threshold

The Japanese Yen edges up against the US Dollar on Friday, but the USD/JPY pair remains above 159.90 at the time of writing, unable to put a significant distance from the 160.00 level, considered the limit of tolerable JPY weakness for Japanese authorities.

Gold returns to the red, awaits US NFP

Gold price is looking to test the weekly lows, while in the red near $4,450 in the early European session on Friday. The precious metal remains vulnerable amid ongoing geopolitical turmoil. Traders will closely monitor the developments surrounding the US-Iran peace deal and the US May employment report later on Friday.


Indian Rupee jumps as RBI holds, but unveils measures to boost foreign inflows

The Reserve Bank of India held the Repo Rate at 5.25%, as widely expected, on Friday. But the central bank unveiled various measures to boost foreign inflows into the economy, lifting the Indian Rupee against the US Dollar.

Top 3 Price Prediction: Bitcoin eyes $60,000, Ethereum risks $1,750, XRP could test $1

Bitcoin, Ethereum, and Ripple prices edge lower on Friday, extending a steady decline of roughly 15% so far this week. Institutional outflows weigh on Bitcoin and Ethereum while XRP largely follows the broader market trend.

Recession on paper: What really moves the Canadian Loonie now?

Statistics Canada handed the headline writers a gift and the analysts a headache. Real GDP shrank 0.1% on an annualized basis in the first quarter, and with the fourth quarter of 2025 revised down to a 1.0% contraction, that is two negative quarters in a row, the textbook definition of a technical recession and Canada's first since the pandemic.