|

AUD/USD Price Analysis: Approaches H&S neckline below 0.6900

  • The recovery move by AUD/USD might meet offers amid the risk-off mood.
  • A surprise rise in the US inflation would accelerate rate hike odds by the Fed.
  • A confident drop below the H&S neckline will trigger a bearish reversal.

The AUD/USD pair has shown a responsive buying action after surrendering the round-level support of 0.6900 in the Asian session. The Aussie asset has attempted a recovery move, however, the Australian Dollar could retreat ahead as the risk impulse is quite negative amid airborne threats to the United States.

The US Dollar Index (DXY) is expected to recapture the 103.50 resistance ahead investors are getting anxious ahead of the release of the United State inflation data. S&P500 futures are extending their losses as investors are expecting that a surprise rise in the US inflation would accelerate rate hike odds by the Federal Reserve (Fed) and eventually will escalate recession fears. The 10-year US Treasury yields are struggling to extend gains above 3.75%.

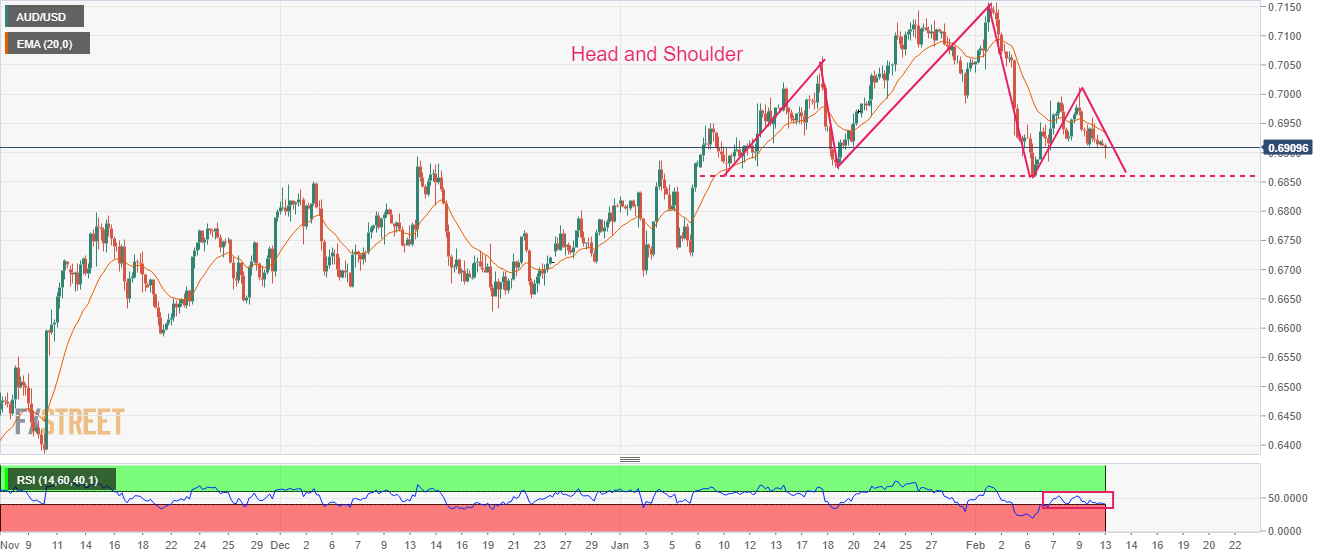
AUD/USD is completing the last leg of the Head and Shoulder chart pattern on a four-hour scale. The aforementioned chart pattern is a prolonged consolidation and a breakdown of the neckline plotted from the January 10 low at 0.6860 will trigger a bearish reversal.

The asset is facing barricades each time encountering the 20-period Exponential Moving Average (EMA) at 0.6398, indicating more weakness ahead.

Meanwhile, the Relative Strength Index (RSI) (14) is struggling to sustain itself in the 40.00-60.00 range. A slippage into the bearish range of 20.00-40.00 will trigger the bearish momentum.

A breakdown below the neckline plotted from January 10 low at 0.6860 will drag the asset toward December 28 high around 0.6800. A slippage below the latter will further drag the asset toward December 22 high at 0.6767.

In an alternate scenario, a decisive break above the psychological resistance of 0.7000 will drive the asset towards January 18 high at 0.7064 followed by January 26 high at 0.7143.

AUD/USD four-hour chart

AUD/USD

Overview
Today last price0.6906
Today Daily Change-0.0013
Today Daily Change %-0.19
Today daily open0.6919
 
Trends
Daily SMA200.7001
Daily SMA500.6869
Daily SMA1000.6684
Daily SMA2000.6806
 
Levels
Previous Daily High0.696
Previous Daily Low0.6909
Previous Weekly High0.7011
Previous Weekly Low0.6856
Previous Monthly High0.7143
Previous Monthly Low0.6688
Daily Fibonacci 38.2%0.6929
Daily Fibonacci 61.8%0.6941
Daily Pivot Point S10.6899
Daily Pivot Point S20.6878
Daily Pivot Point S30.6848
Daily Pivot Point R10.695
Daily Pivot Point R20.6981
Daily Pivot Point R30.7001

Author

Sagar Dua

Sagar Dua

FXStreet

Sagar Dua is associated with the financial markets from his college days. Along with pursuing post-graduation in Commerce in 2014, he started his markets training with chart analysis.

More from Sagar Dua
Share:

Markets move fast. We move first.

Orange Juice Newsletter brings you expert driven insights - not headlines. Every day on your inbox.

By subscribing you agree to our Terms and conditions.

Editor's Picks

EUR/USD flatlines below 1.1800 amid trading lull, awaits Fed Minutes

EUR/USD trades around a flatline below 1.1800 in European trading on Tuesday. The pair lacks any trading impetus as the US Dollar moves little amid market caution ahead of the Fed's December Meeting Minutes release, which could offer insights into the Federal Reserve’s 2026 outlook.

GBP/USD retakes 1.3500 despite the year-end grind

GBP/USD finds fresh demand and retakes 1.3500 on Tuesday as markets grind through the last trading week of the year. Despite the latest uptick, the pair is unlikely to see further progress due to the year-end holiday volumes.

Gold holds the bounce on Fed rate cut bets, safe-haven flows

Gold holds the rebound near $4,350 in the European trading hours on Tuesday. The precious metal recovers some lost ground after falling 4.5% in the previous session, which was Gold's largest single-day loss since October. Increased margin requirements on gold and silver futures by the Chicago Mercantile Exchange Group, one of the world’s largest trading floors for commodities, prompted widespread profit-taking and portfolio rebalancing.

Tron steadies as Justin Sun invests $18 million in Tron Inc.

Tron (TRX) trades above $0.2800 at press time on Monday, hovering below the 50-day Exponential Moving Average (EMA) at $0.2859.

Economic outlook 2026-2027 in advanced countries: Solidity test

After a year marked by global economic resilience and ending on a note of optimism, 2026 looks promising and could be a year of solid economic performance. In our baseline scenario, we expect most of the supportive factors at work in 2025 to continue to play a role in 2026.

Crypto market outlook for 2026

Year 2025 was volatile, as crypto often is.  Among positive catalysts were favourable regulatory changes in the U.S., rise of Digital Asset Treasuries (DAT), adoption of AI and tokenization of Real-World-Assets (RWA).