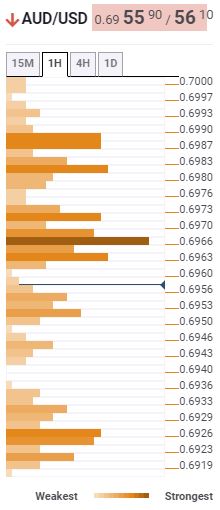
- The Confluence Detector is showing that 0.6966 could be an intraday resistance.
- Ahead of the Asian session the pair has fallen 0.35% but could retrace for a breather.
AUD/USD 30-minute chart
The chart below shows that AUD/USD has struggled in the US session but is now consolidating near 0.6958. The market has now moved under the pivotal 0.70 level once again as a bout of risk-off pressure enters the markets. There has also been an escalation if tensions between Australia and China after the Australian government said it would make it easier for Hong Kong nations to settle in the nation.
The red resistance line on the chart is the level highlighted on the confluence detector below. The pair might move back and retrace after the move lower earlier in the session. Its quite clear that the indicators are bearish for the day as the Relative Strength Index holds near the oversold area and the MACD histogram is still red. The MACD signal lines have also crossed over to the downside, which is another bearish signal.
Confluence detector
Additional levels
All information and content on this website, from this website or from FX daily ltd. should be viewed as educational only. Although the author, FX daily ltd. and its contributors believe the information and contents to be accurate, we neither guarantee their accuracy nor assume any liability for errors. The concepts and methods introduced should be used to stimulate intelligent trading decisions. Any mention of profits should be considered hypothetical and may not reflect slippage, liquidity and fees in live trading. Unless otherwise stated, all illustrations are made with the benefit of hindsight. There is risk of loss as well as profit in trading. It should not be presumed that the methods presented on this website or from material obtained from this website in any manner will be profitable or that they will not result in losses. Past performance is not a guarantee of future results. It is the responsibility of each trader to determine their own financial suitability. FX daily ltd. cannot be held responsible for any direct or indirect loss incurred by applying any of the information obtained here. Futures, forex, equities and options trading contains substantial risk, is not for every trader, and only risk capital should be used. Any form of trading, including forex, options, hedging and spreads, contains risk. Past performance is not indicative of future FX daily ltd. are not Registered Financial Investment Advisors, securities brokers-dealers or brokers of the U.S. Securities and Exchange Commission or with any state securities regulatory authority OR UK FCA. We recommend consulting with a registered investment advisor, broker-dealer, and/or financial advisor. If you choose to invest, with or without seeking advice, then any consequences resulting from your investments are your sole responsibility FX daily ltd. does not assume responsibility for any profits or losses in any stocks, options, futures or trading strategy mentioned on the website, newsletter, online trading room or trading classes. All information should be taken as educational purposes only.
Recommended content
Editors’ Picks
EUR/USD steady below 1.0800 after US PCE meets expectations
EUR/USD remains depressed below 1.0800 after soft French inflation data, amid minimal volatility and thin liquidity on Good Friday. The pair barely reacted to US PCE inflation data, with the Greenback shedding some pips. Fed Chair Jerome Powell set to speak ahead of the weekly close.
GBP/USD hovers around 1.2620 in dull trading
GBP/USD trades sideways above 1.2600 amid a widespread holiday restraining action across financial markets. Investors took a long weekend ahead of critical United States employment data next week. Fed Chair Powell coming up next.
Gold price sits at all-time highs above $2,230
Gold price holds near a fresh all-time high at $2,236 in thinned trading amid the Easter Holiday. Most major world markets remain closed, although the United States published core PCE inflation, the Federal Reserve’s favorite inflation gauge.
Jito price could hit $6 as JTO coils up inside this bullish pattern
Jito (JTO) price has been on an uptrend since forming a local bottom in early January. Since then, JTO has revisited the key swing point formed in early December, suggesting the bulls’ intention to move higher.
Key events in developed markets next week
Next week, the main focus will be inflation and the labour market in the Eurozone. We expect services inflation to be impacted by the easter effect, while the unemployment rate to be unchanged.