AUD/USD jumps towards 0.6630 on sticky United States inflation
- The United States Consumer Price Index rose to 2.9% YoY in August.
- US Initial Jobless Claims unexpectedly soared in the week ended September 6.
- AUD/USD challenges intraday highs in the 0.6630 area, aiming for higher highs.

The AUD/USD pair changed course early in the American session on Thursday, recovering from an intraday low of 0.6590 after the release of the United States (US) August Consumer Price Index (CPI).
The Bureau of Labor Statistics (BLS) reported that inflation, as measured by the CPI, rose to 2.9% in August from 2.7% in July, as expected. The core annual reading printed at 3.1%, meeting the market’s forecast and matching the July figure. Finally, the monthly CPI rose 0.4%, doubling the previous 0.2% and above the 0.3% anticipated.
Alongside inflation data, the US published Initial Jobless Claims for the week ended September 6, which jumped to 263K from the previous 236K and was much higher than the expected 235K.
Market participants are now betting on three interest rate cuts from the Federal Reserve (Fed) before year's end, one in each upcoming meeting.
As a result, speculative interest chose to sell the Greenback, while US indexes surged, reflecting a better mood and helping AUD/USD recover its bullish poise.
Earlier in the day, Australia published its September Consumer Inflation Expectations, which jumped to 4.7% from the previous 3.9%, weighing on the Aussie.
Technical outlook
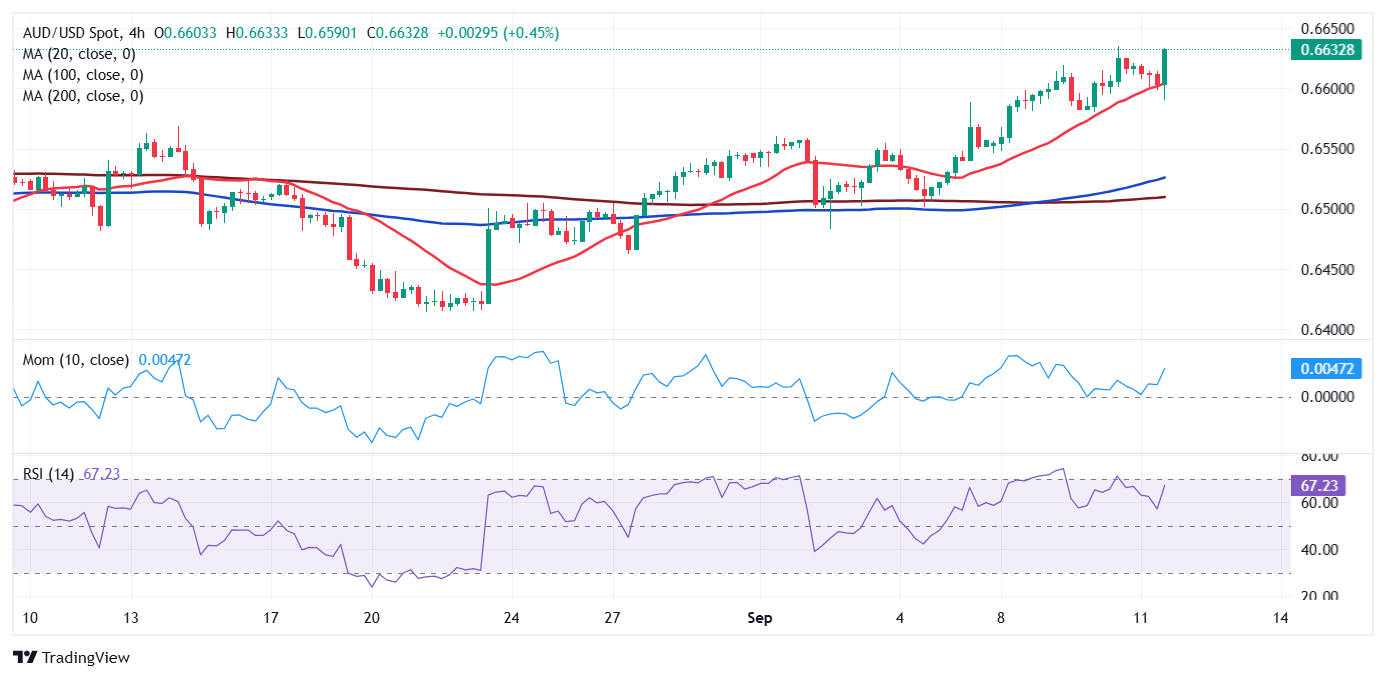
The AUD/USD pair is bullish in the near-term, with the 4-hour chart showing a bullish 20 Simple Moving Average (SMA) attracting buyers on dips. The SMA currently stands at around 0.6600. Other than that, the 100 SMA is slowly grinding north above a directionless 200 SMA, both well below the shorter one, and also a sign of bullish potential. The pair peaked at 0.6635 earlier this week, the immediate resistance level. Further advances expose the 0.6670 area en route to the 0.6700 mark. Support below the 0.6590 intraday low surges at 0.6550.
(This story was corrected on September 11 at 14:07 to say that the previous monthly US CPI reading was 0.2%, not 0.4%.)
Australian Dollar Price Today
The table below shows the percentage change of Australian Dollar (AUD) against listed major currencies today. Australian Dollar was the strongest against the Canadian Dollar.
| USD | EUR | GBP | JPY | CAD | AUD | NZD | CHF | |
|---|---|---|---|---|---|---|---|---|
| USD | -0.38% | -0.16% | 0.06% | -0.09% | -0.21% | -0.24% | -0.30% | |
| EUR | 0.38% | 0.21% | 0.33% | 0.30% | 0.13% | 0.17% | 0.04% | |
| GBP | 0.16% | -0.21% | 0.12% | 0.06% | -0.14% | -0.04% | -0.18% | |
| JPY | -0.06% | -0.33% | -0.12% | -0.08% | -0.24% | -0.16% | -0.29% | |
| CAD | 0.09% | -0.30% | -0.06% | 0.08% | -0.26% | -0.13% | -0.22% | |
| AUD | 0.21% | -0.13% | 0.14% | 0.24% | 0.26% | 0.04% | -0.09% | |
| NZD | 0.24% | -0.17% | 0.04% | 0.16% | 0.13% | -0.04% | -0.15% | |
| CHF | 0.30% | -0.04% | 0.18% | 0.29% | 0.22% | 0.09% | 0.15% |
The heat map shows percentage changes of major currencies against each other. The base currency is picked from the left column, while the quote currency is picked from the top row. For example, if you pick the Australian Dollar from the left column and move along the horizontal line to the US Dollar, the percentage change displayed in the box will represent AUD (base)/USD (quote).
Author
FXStreet Team
FXStreet
Composed of a group of economic journalists and FX experts, the FXStreet content team produces and oversees all content published on FXStreet. It provides a purely journalistic approach to the Forex market.


