AUD/USD drifts away from 0.6590 highs on weak Australian consumption data
- The Aussie Dollar drifts lower following downbeat Australian Retail sales data
- Strong US Job Openings and manufacturing activity have given some support to the US Dollar.
- AUS/USD is forming a potential "Evening Star" pattern, a bearish figure.
The Aussie Dollar was capped on Tuesday at Year-to-date highs near 0.6600 and is trading lower on Wednesday as Australian Retail Sales and construction data from May disappointed.
The US Dollar, on the other hand, is trimming some losses as favoured by upbeat US employment and manufacturing data released on Tuesday..
Also on Tuesday, Powell reiterated that the bank should keep waiting for the likely inflationary impact of Trump’s tariffs before cutting interest rates and left the market waiting for further US employment figures this week, to assess the chances of upcoming rate cuts.
Technical analysis: Potential “Evening Star” pattern
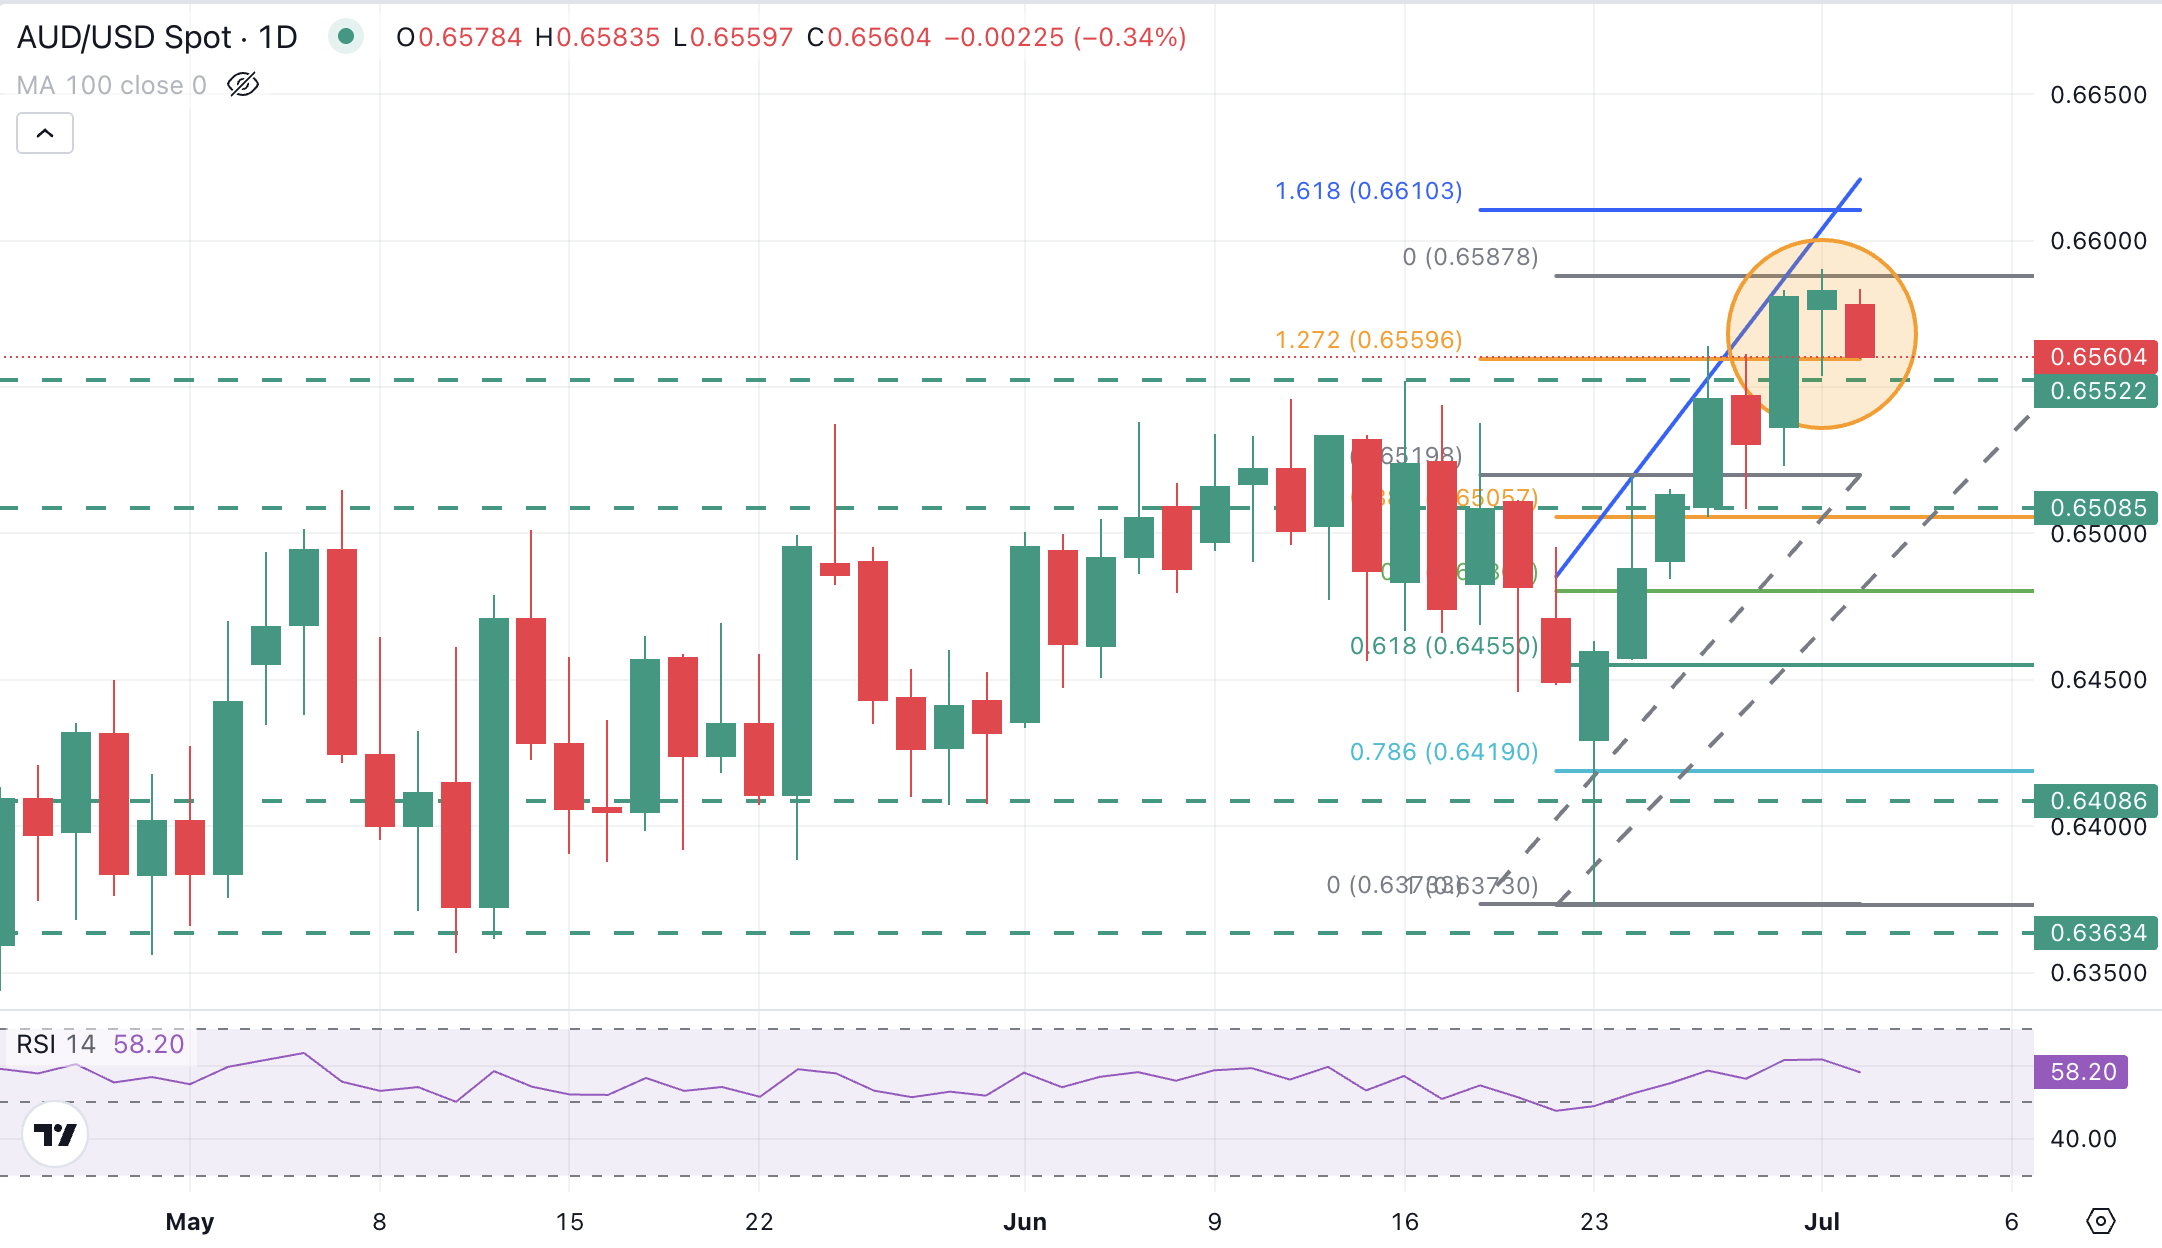
From a technical perspective, Wednesday’s negative candle in the daily chart is on track to complete a “Evening Star” pattern, a common sign for trend shifts, that might confirm a deeper correction.
A break below Tuesday’s low, which is also the mid-June top, at the 0.6550 area would confirm the mentioned pattern and bring the June 25 low and the 38.6% Fibonacci retracement of the rally from June 20 lows back to the table.
On the upside, immediate resistance is at Tuesday’s high, at the 0.6590 area, and then probably the 161.8% Fibonacci extension of the June 23-24 rally, at 0.6610.
Economic Indicator
Building Permits (MoM)
The Building Permits released by the Australian Bureau of Statistics shows the number of permits for new construction projects. It implies the movement of corporate investments (the Australian economic development). It tends to cause some volatility to the AUD. The more growing number of permits, the more positive (or bullish) for the AUD.
Read more.Last release: Wed Jul 02, 2025 01:30
Frequency: Monthly
Actual: 3.2%
Consensus: 4.8%
Previous: -5.7%
Source: Australian Bureau of Statistics
Economic Indicator
Retail Sales s.a. (MoM)
The Retail Sales data, released by the Australian Bureau of Statistics on a monthly basis, measures the value of goods sold by retailers in Australia. Changes in Retail Sales are widely followed as an indicator of consumer spending. Percent changes reflect the rate of changes in such sales, with the MoM reading comparing sales values in the reference month with the previous month. Generally, a high reading is seen as bullish for the Australian Dollar (AUD), while a low reading is seen as bearish.
Read more.Last release: Wed Jul 02, 2025 01:30
Frequency: Monthly
Actual: 0.2%
Consensus: 0.4%
Previous: -0.1%
Source: Australian Bureau of Statistics
The primary gauge of Australia’s consumer spending, the Retail Sales, is released by the Australian Bureau of Statistics (ABS) about 35 days after the month ends. It accounts for approximately 80% of total retail turnover in the country and, therefore, has a significant bearing on inflation and GDP. This leading indicator has a direct correlation with inflation and the growth prospects, impacting the Reserve Bank of Australia’s (RBA) interest rates decision and AUD valuation. The stats bureau uses the forward factor method, ensuring that the seasonal factors are not distorted by COVID-19 impacts.
Author

Guillermo Alcala
FXStreet
Graduated in Communication Sciences at the Universidad del Pais Vasco and Universiteit van Amsterdam, Guillermo has been working as financial news editor and copywriter in diverse Forex-related firms, like FXStreet and Kantox.


