|

AUD/NZD Technical Analysis: Awaits RBNZ at Pivot-Point 'breakout' level
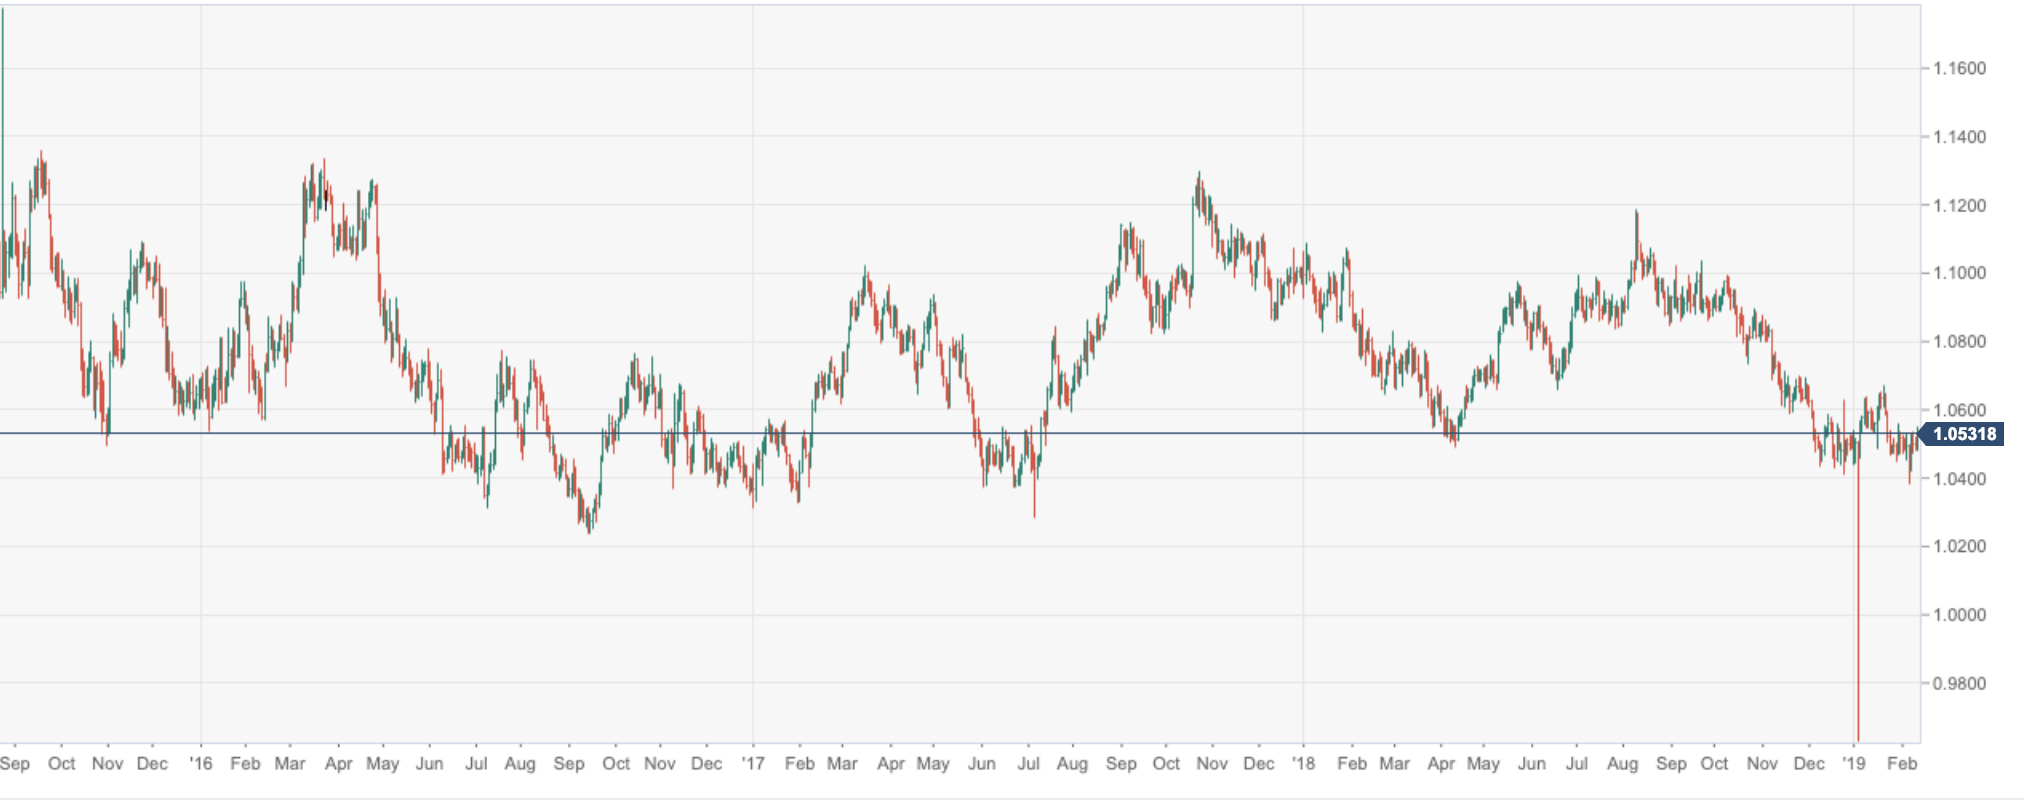
AUD/NZD chart

AUD/NZD is accumulated around the daily pivot point at 1.0822 ahead of the RBNZ event and in breakout territory. 

When is the RBNZ and how might it affect NZD/USD?

  • S1 is located at 1.0500.
  • S2 is located at 1.0460.
  • S3 is located at 1.0437. 
  • A break beyond S3 targets 1.0398 swing low fractal, guarding territory towards the June 27th swing low of 1.0371 ahead of the flash crash lows down at 1.0192.
  • R1 is located at 1.0562.
  • R2 is located at 1.0585.
  • R3 is located at 1.0624.
  • Upside Fibo targets are located at 1.0692 (50%) and 1.0807 (61.8%). 1.0774 is the 200-D SMA. 

Author

Ross J Burland

Ross J Burland, born in England, UK, is a sportsman at heart. He played Rugby and Judo for his county, Kent and the South East of England Rugby team.

More from Ross J Burland
Share:

Editor's Picks

EUR/USD holds lower ground near 1.1850 ahead of EU/ US data

EUR/USD remains in the negative territory for the fourth successive session, trading around 1.1850 in European trading on Friday. A broadly cautious market environment paired with modest US Dollar demand undermines the pair ahead of the Eurozone GDP second estimate and the critical US CPI data. 

GBP/USD keeps losses around 1.3600, awaits US CPI for fresh impetus

GBP/USD holds moderate losses at around 1.3600 in the European session on Friday, though it lacks bearish conviction. The US Dollar remains supported amid softer risk tone and ahead of the US consumer inflation figures due later in the NA session on Friday. 

Gold trims intraday gains to $5,000 as US inflation data loom

Gold retreats from the vicinity of the $5,000 psychological mark, though sticks to its modest intraday gains heading into the European session. Traders now look forward to the release of the US consumer inflation figures for more cues about the Fed policy path. The outlook will play a key role in influencing the near-term US Dollar price dynamics and provide some meaningful impetus to the non-yielding bullion.

Solana: Mixed market sentiment caps recovery

Solana is trading at $79 as of Friday, following a correction of over 9% so far this week. On-chain and derivatives data indicates mixed sentiment among traders, further limiting the chances of a price recovery.

A tale of two labour markets: Headline strength masks underlying weakness

Undoubtedly, yesterday’s delayed US January jobs report delivered a strong headline – one that surpassed most estimates. However, optimism quickly faded amid sobering benchmark revisions.

Solana Price Forecast: Mixed market sentiment caps recovery

Solana (SOL) is trading at $79 as of Friday, following a correction of over 9% so far this week. On-chain and derivatives data indicates mixed sentiment among traders, further limiting the chances of a price recovery.