|

AUD/NZD Price Analysis: Drops back to 100-SMA, weekly support despite softer New Zealand inflation

  • AUD/NZD drops 40 pips even as New Zealand Q2 CPI defends RBNZ status quo.
  • New Zealand Q2 CPI eases to 1.1% QoQ, 6.0% YoY.
  • Overbought RSI also favored sellers but 100-SMA, rising trend line from Monday prod bears.
  • 61.8% Fibonacci retracement, seven-week-old descending support line challenge sellers; bulls need validation from 200-SMA.

AUD/NZD fails to justify downbeat New Zealand inflation numbers on early Wednesday as it slumps to 1.0790 following the data, before recovering to 1.0815 by the press time. In doing so, the exotic pair also takes clues from the overbought RSI while bouncing off the 100-SMA and an upward-sloping support line stretched from Monday.

That said, New Zealand’s (NZ) headline inflation, per the Consumer Price Index (CPI), edges lower to 1.1% QoQ and 6.0% YoY for the second quarter (Q2) of 2023 versus 1.2% and 6.7% respective priors.

Also read: New Zealand Q2 CPI eases to 1.1% QoQ, NZD/USD marches to 0.6300

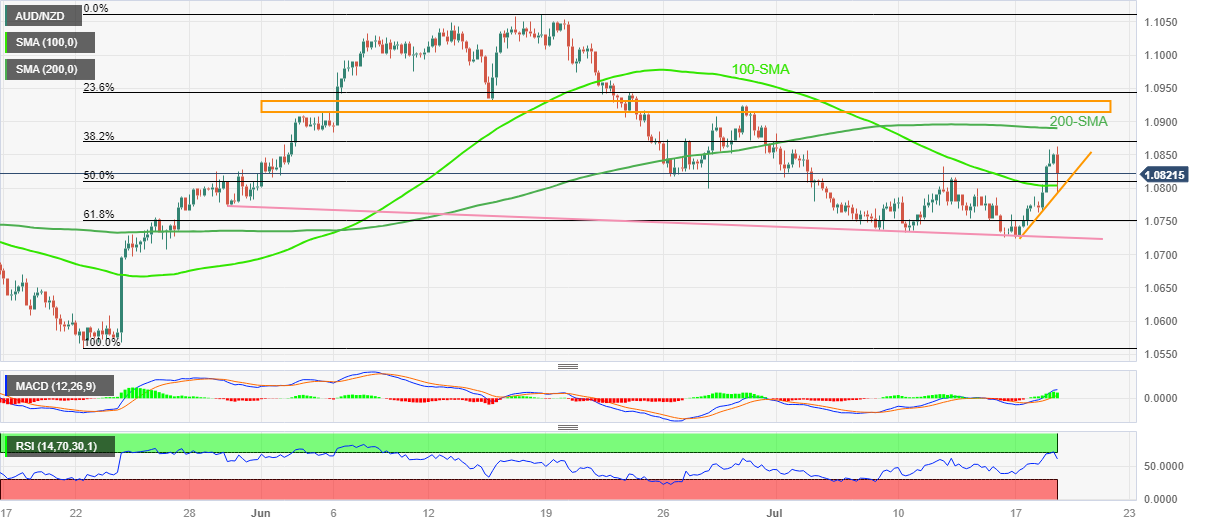
It should be noted that the bullish MACD signals and the return of the RSI to the normal region, between 70 and 30, defend the AUD/NZD buyers.

With this, the quote is likely to challenge the latest peak of around 1.0860 before eyeing the 200-SMA hurdle surrounding 1.0890.

However, the 1.0900 round figure and a broad horizontal resistance area established since early June, around 1.0915-30, will be crucial for the AUD/NZD bulls to cross afterward if they want to keep the reins.

On the flip side, the 100-SMA and the aforementioned support line restrict immediate AUD/NZD downside near 1.0800-795, a break of which can drag the quote toward the 61.8% Fibonacci retracement of its May-June upside, near 1.0750.

Following that, a descending trend line from May 30, close to 1.0730 at the latest, will act as the last defense of the AUD/NZD buyers.

AUD/NZD: Four-hour chart

Trend: Recovery expected

Additional important levels

Overview
Today last price1.0816
Today Daily Change0.0039
Today Daily Change %0.36%
Today daily open1.0777
 
Trends
Daily SMA201.0832
Daily SMA501.0823
Daily SMA1001.079
Daily SMA2001.0831
 
Levels
Previous Daily High1.0782
Previous Daily Low1.0725
Previous Weekly High1.0832
Previous Weekly Low1.0726
Previous Monthly High1.1062
Previous Monthly Low1.0796
Daily Fibonacci 38.2%1.076
Daily Fibonacci 61.8%1.0747
Daily Pivot Point S11.0741
Daily Pivot Point S21.0704
Daily Pivot Point S31.0683
Daily Pivot Point R11.0798
Daily Pivot Point R21.0819
Daily Pivot Point R31.0856

Author

Anil Panchal

Anil Panchal

FXStreet

Anil Panchal has nearly 15 years of experience in tracking financial markets. With a keen interest in macroeconomics, Anil aptly tracks global news/updates and stays well-informed about the global financial moves and their implications.

More from Anil Panchal
Share:

Markets move fast. We move first.

Orange Juice Newsletter brings you expert driven insights - not headlines. Every day on your inbox.

By subscribing you agree to our Terms and conditions.

Editor's Picks

EUR/USD moves sideways below 1.1800 on Christmas Eve

EUR/USD struggles to find direction and trades in a narrow channel below 1.1800 after posting gains for two consecutive days. Bond and stock markets in the US will open at the usual time and close early on Christmas Eve, allowing the trading action to remain subdued. 

GBP/USD keeps range around 1.3500 amid quiet markets

GBP/USD keeps its range trade intact at around 1.3500 on Wednesday. The Pound Sterling holds the upper hand over the US Dollar amid pre-Christmas light trading as traders move to the sidelines heading into the holiday season. 

Gold retreats from record highs, trades below $4,500

Gold retreats after setting a new record-high above $4,520 earlier in the day and trades in a tight range below $4,500 as trading volumes thin out ahead of the Christmas break. The US Dollar selling bias remains unabated on the back of dovish Fed expectations, which continues to act as a tailwind for the bullion amid persistent geopolitical risks.

Bitcoin slips below $87,000 as ETF outflows intensify, whale participation declines

Bitcoin price continues to trade around $86,770 on Wednesday, after failing to break above the $90,000 resistance. US-listed spot ETFs record an outflow of $188.64 million on Tuesday, marking the fourth consecutive day of withdrawals.

Economic outlook 2026-2027 in advanced countries: Solidity test

After a year marked by global economic resilience and ending on a note of optimism, 2026 looks promising and could be a year of solid economic performance. In our baseline scenario, we expect most of the supportive factors at work in 2025 to continue to play a role in 2026.

Avalanche struggles near $12 as Grayscale files updated form for ETF

Avalanche trades close to $12 by press time on Wednesday, extending the nearly 2% drop from the previous day. Grayscale filed an updated form to convert its Avalanche-focused Trust into an ETF with the US Securities and Exchange Commission.

AUD/NZD Price Analysis: Drops back to 100-SMA, weekly support despite softer New Zealand inflation