|

AUD/NZD Price Analysis: Bulls poke 10-week-old hurdle above 1.0900 after Aussie, NZ inflation

  • AUD/NZD takes the bids to refresh one-week high after upbeat quarterly inflation data from Australia, New Zealand.
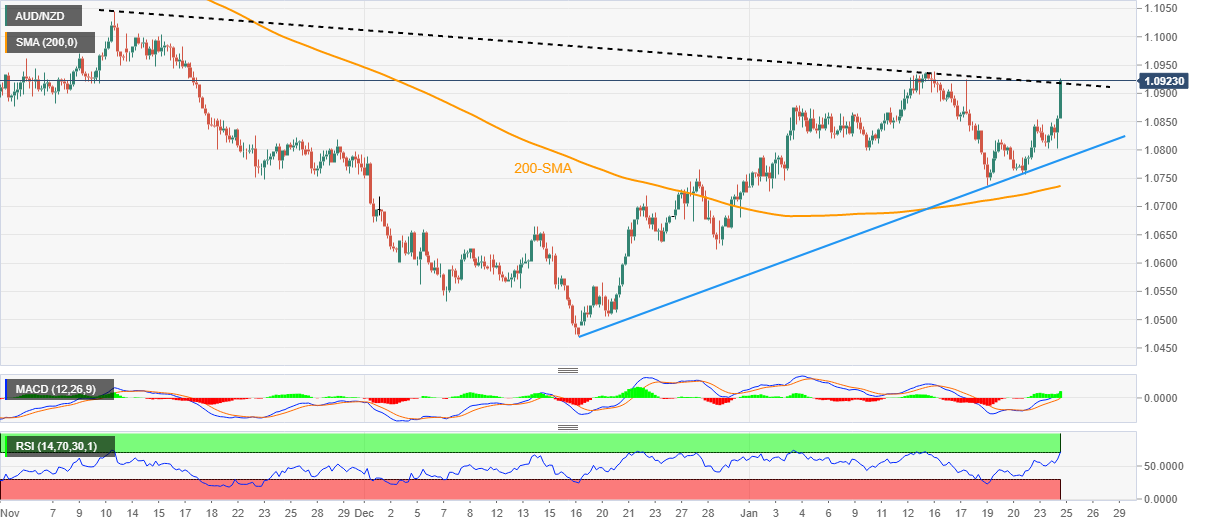
  • Overbought RSI, descending resistance line from November 11 challenge pair buyers.
  • Five-week-old ascending trend line, 200-SMA restrict short-term declines.

AUD/NZD jumps the most in three weeks after inflation data from Australia and New Zealand published upbeat results early Wednesday. That said, the exotic pair grinds higher past 1.0900 at the latest, following the recent run-up to 1.0926.

Earlier in the day, New Zealand Consumer Price Index (CPI) for the fourth quarter (Q4) rose past 7.1% YoY market forecast to reprint the 7.2% figures while the QoQ data suggests a 1.4% number against 1.3% expected and 2.2% prior. It’s worth noting that the Reserve Bank of New Zealand (RBNZ) anticipated 7.5% yearly inflation in its November meeting.

Following that Australia’s Q4 CPI rose to 7.8% YoY versus 7.5% expected and 7.3% prior while the RBA Trimmed Mean CPI jumped to 6.9% YoY compared to 6.5% market forecasts and 6.1% previous readings. Further, the Monthly CPI rose to 8.4% from 7.3% previous readings and 7.7% market forecasts.

Given the comparatively stronger Aussie inflation numbers, the AUD/NZD pair pokes a downward-sloping resistance line from November 11, around 1.0920 by the press time. However, the overbought RSI and fears of the Reserve Bank of Australia’s (RBA) less-hawkish play challenge the pair buyers. Also acting as an immediate upside hurdle is the monthly peak surrounding 1.0940.

It’s worth mentioning that the bullish MACD signals keep the AUD/NZD buyers hopeful. That said, the five-week-long rising trend line and the 200-SMA restrict the quote’s immediate downside to around 1.0780 and 1.0735 respectively.

Overall, AUD/NZD is likely to remain firmer but the upside room appears limited.

AUD/NZD: Four-hour chart

Trend: Pullback expected

Additional important levels

Overview
Today last price1.0924
Today Daily Change0.0092
Today Daily Change %0.85%
Today daily open1.0832
 
Trends
Daily SMA201.0815
Daily SMA501.0739
Daily SMA1001.0953
Daily SMA2001.1004
 
Levels
Previous Daily High1.0848
Previous Daily Low1.0803
Previous Weekly High1.0938
Previous Weekly Low1.0738
Previous Monthly High1.0792
Previous Monthly Low1.0471
Daily Fibonacci 38.2%1.082
Daily Fibonacci 61.8%1.0831
Daily Pivot Point S11.0807
Daily Pivot Point S21.0783
Daily Pivot Point S31.0763
Daily Pivot Point R11.0852
Daily Pivot Point R21.0872
Daily Pivot Point R31.0897

Author

Anil Panchal

Anil Panchal

FXStreet

Anil Panchal has nearly 15 years of experience in tracking financial markets. With a keen interest in macroeconomics, Anil aptly tracks global news/updates and stays well-informed about the global financial moves and their implications.

More from Anil Panchal
Share:

Markets move fast. We move first.

Orange Juice Newsletter brings you expert driven insights - not headlines. Every day on your inbox.

By subscribing you agree to our Terms and conditions.

Editor's Picks

EUR/USD retreats below 1.1750 on modest USD recovery

EUR/USD stays under modest bearish pressure and trades below 1.1750 on Friday. Although trading conditions remain thin following the New Year holiday and ahead of the weekend, the modest recovery seen in the US Dollar causes the pair to edge lower. The economic calendar will not feature any high-impact data releases.

GBP/USD struggles to gain traction, stabilizes above 1.3450

After testing 1.3400 on the last day of 2025, GBP/USD managed to stage a rebound. Nevertheless, the pair finds it difficult to gather momentum and moves sideways above 1.3450 as market participants remain in holiday mood.

Gold climbs toward $4,400 following deep correction

Gold reverses its direction and advances toward $4,400 after suffering heavy losses amid profit-taking before the New Year holiday. Growing expectations for a dovish Fed policy and persistent geopolitical risks seem to be helping XAU/USD stretch higher.

Cardano gains early New Year momentum, bulls target falling wedge breakout

Cardano kicks off the New Year on a positive note and is extending gains, trading above $0.36 at the time of writing on Friday. Improving on-chain and derivatives data point to growing bullish interest, while the technical outlook keeps an upside breakout in focus.

Economic outlook 2026-2027 in advanced countries: Solidity test

After a year marked by global economic resilience and ending on a note of optimism, 2026 looks promising and could be a year of solid economic performance. In our baseline scenario, we expect most of the supportive factors at work in 2025 to continue to play a role in 2026.

Crypto market outlook for 2026

Year 2025 was volatile, as crypto often is.  Among positive catalysts were favourable regulatory changes in the U.S., rise of Digital Asset Treasuries (DAT), adoption of AI and tokenization of Real-World-Assets (RWA).