|
AUD/JPY Technical Analysis: Drops 100 pips, hits 20-day low and looks oversold on intraday charts
- AUD/JPY fell to 81.11 - the lowest level since May 30.
- The pair could extend losses further on fears the US and China are heading for a long, griding trade war.
- However, the pair looks oversold as per the RSO on the 15-minute, hourly and 4-hour chart. So the bearish momentum may weaken.

Hourly chart
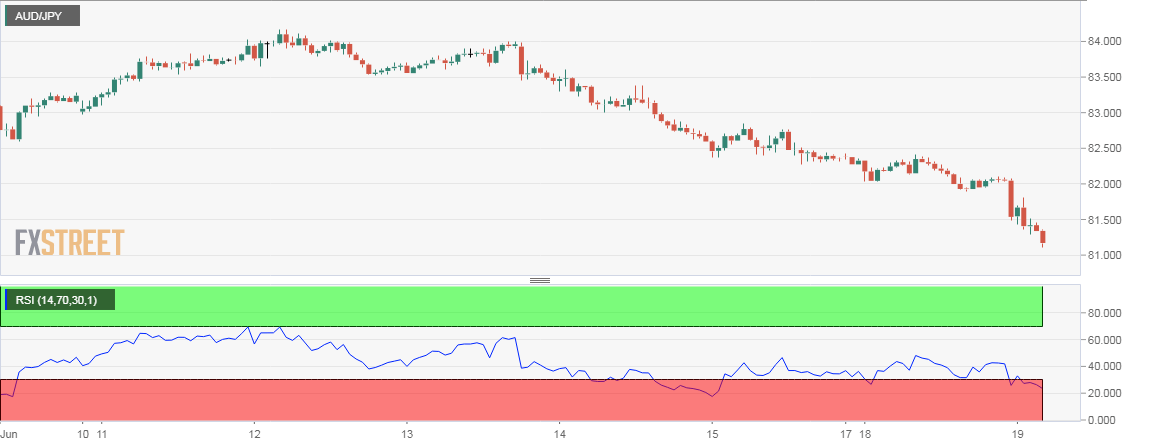
Spot Rate: 81.13
Daily High: 82.09
Daily Low: 81.12
Trend: Cautiously bearish
R1: 81.49 (March 5 low)
R2: 82.00 (psychological hurdle)
R3: 82.37 (5-day moving average)
Support
S1: 81.00 (psychological support)
S2: 80.50 (March 23 low)
S3: 80.00 (psychological support)
Author

Omkar Godbole
FXStreet Contributor
Omkar Godbole, editor and analyst, joined FXStreet after four years as a research analyst at several Indian brokerage companies.
More from Omkar Godbole


