AUD/JPY retreats as a Harami candle signals bulls may be running out of steam
- AUD/JPY bulls fail to break through psychological resistance at 97.00.
- The Relative Strength Index falls from overbought conditions as AUD/JPY bulls retreat.
- A Harami pattern on the AUD/JPY daily chart highlights market indecision.

The Australian Dollar (AUD) is weakening against the Japanese Yen (JPY) on Monday, as the steep bullish rally pertaining to the AUD/JPY pair shows clear signs of slowing.
At the time of writing, AUD/JPY is consolidating near 96.70, with the formation of a Harami candlestick pattern on the daily chart, reflecting market indecision.
This potential reversal signal arises as the pair approaches a critical resistance zone. AUD/JPY has recently broken above the 61.8% Fibonacci retracement of the November 2024 to April 2025 decline, located at 96.15, a level considered technically significant.
Additionally, the pair is trading just above the 200-day Simple Moving Average (SMA), currently set at 95.80. This long-term trend indicator, which has historically served as a dynamic resistance, may now be providing initial support.
AUD/JPY daily chart
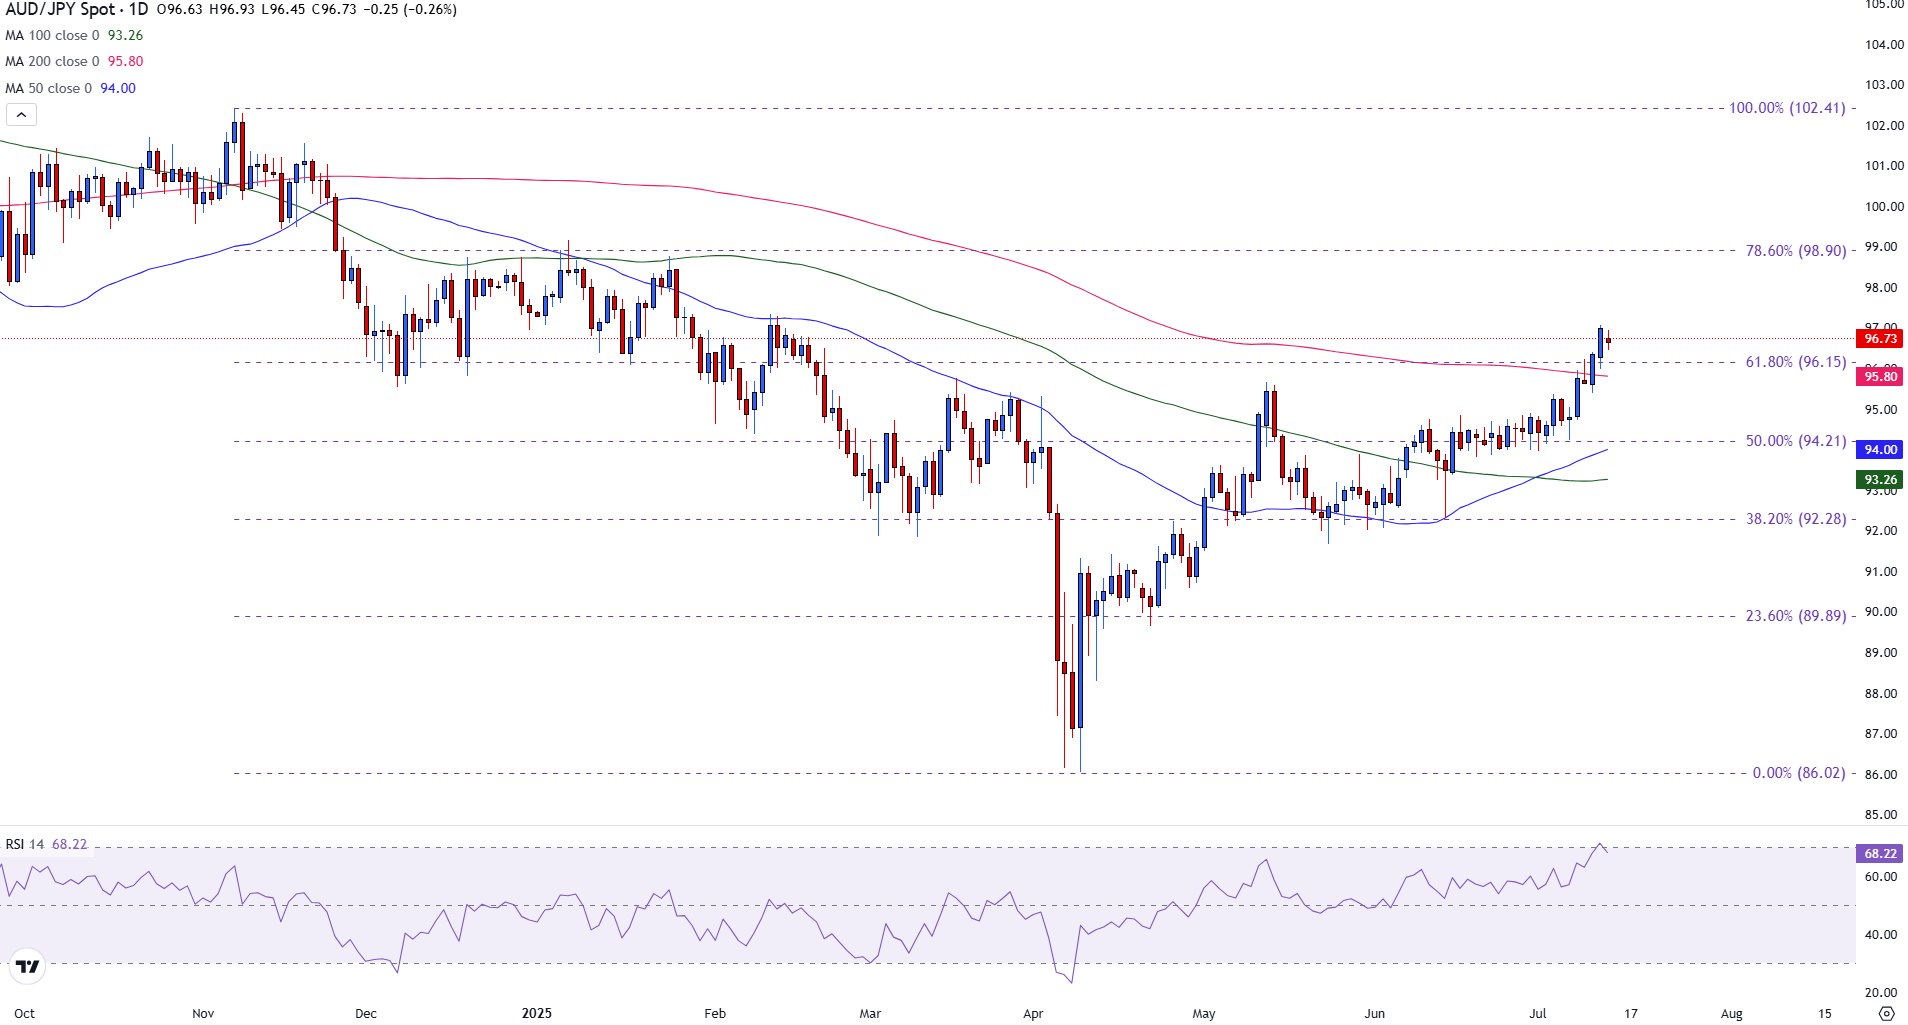
Despite the near-term pause, the broader uptrend remains intact. The 50-day SMA is trending upward at 94.10, while the 100-day SMA continues to rise around 93.20, reflecting sustained medium-term bullish momentum.
However, the Relative Strength Index (RSI) is hovering just below the 70 threshold, suggesting that the pair remains near overbought territory and may be vulnerable to a technical pullback.
The appearance of the Harami pattern below the 97.00 resistance level underscores the growing hesitation among buyers. While the formation alone does not confirm a reversal, it does highlight reduced bullish conviction at a key technical juncture. Should the pair break decisively above 97.00, it could trigger further gains toward the 78.6% Fibonacci retracement level near 98.90.
Conversely, if downside pressure persists, initial support is expected at 96.15, followed by the 50-day SMA at 94.10. A break beneath these levels may open the door to a deeper correction toward the 50% retracement level at 94.21 or the 100-day SMA at 93.20.
While the prevailing trend remains upward, short-term technical signals are flashing caution. Without a clear breakout above 97.00, the pair may enter a consolidation phase or face a moderate correction as bullish momentum temporarily fades.
Australian Dollar FAQs
One of the most significant factors for the Australian Dollar (AUD) is the level of interest rates set by the Reserve Bank of Australia (RBA). Because Australia is a resource-rich country another key driver is the price of its biggest export, Iron Ore. The health of the Chinese economy, its largest trading partner, is a factor, as well as inflation in Australia, its growth rate and Trade Balance. Market sentiment – whether investors are taking on more risky assets (risk-on) or seeking safe-havens (risk-off) – is also a factor, with risk-on positive for AUD.
The Reserve Bank of Australia (RBA) influences the Australian Dollar (AUD) by setting the level of interest rates that Australian banks can lend to each other. This influences the level of interest rates in the economy as a whole. The main goal of the RBA is to maintain a stable inflation rate of 2-3% by adjusting interest rates up or down. Relatively high interest rates compared to other major central banks support the AUD, and the opposite for relatively low. The RBA can also use quantitative easing and tightening to influence credit conditions, with the former AUD-negative and the latter AUD-positive.
China is Australia’s largest trading partner so the health of the Chinese economy is a major influence on the value of the Australian Dollar (AUD). When the Chinese economy is doing well it purchases more raw materials, goods and services from Australia, lifting demand for the AUD, and pushing up its value. The opposite is the case when the Chinese economy is not growing as fast as expected. Positive or negative surprises in Chinese growth data, therefore, often have a direct impact on the Australian Dollar and its pairs.
Iron Ore is Australia’s largest export, accounting for $118 billion a year according to data from 2021, with China as its primary destination. The price of Iron Ore, therefore, can be a driver of the Australian Dollar. Generally, if the price of Iron Ore rises, AUD also goes up, as aggregate demand for the currency increases. The opposite is the case if the price of Iron Ore falls. Higher Iron Ore prices also tend to result in a greater likelihood of a positive Trade Balance for Australia, which is also positive of the AUD.
The Trade Balance, which is the difference between what a country earns from its exports versus what it pays for its imports, is another factor that can influence the value of the Australian Dollar. If Australia produces highly sought after exports, then its currency will gain in value purely from the surplus demand created from foreign buyers seeking to purchase its exports versus what it spends to purchase imports. Therefore, a positive net Trade Balance strengthens the AUD, with the opposite effect if the Trade Balance is negative.
Author

Tammy Da Costa, CFTe®
FXStreet
Tammy is an economist and market analyst with a deep passion for financial markets, particularly commodities and geopolitics.


