• AUD/JPY advances for fifth straight day, up 0.04% in early Asia.
  • Pair tests descending trendline from 2024 highs, aided by bullish RSI.
  • Break above 95.00 targets 95.63 and February high of 97.32.
  • Support seen at 94.00, with key levels at 93.46 (Senkou Span B) and 93.29 (Tenkan-sen).

The AUD/JPY advances for the fifth straight trading session, up by a modest 0.04% as Wednesday’s Asian session begins. On Tuesday, the pair bounced off daily lows of 93.88 and posted gains of over 0.33%, closing the day near the actual price at 94.50, fueled by an improvement in risk appetite, as US-China talks extended for another day.

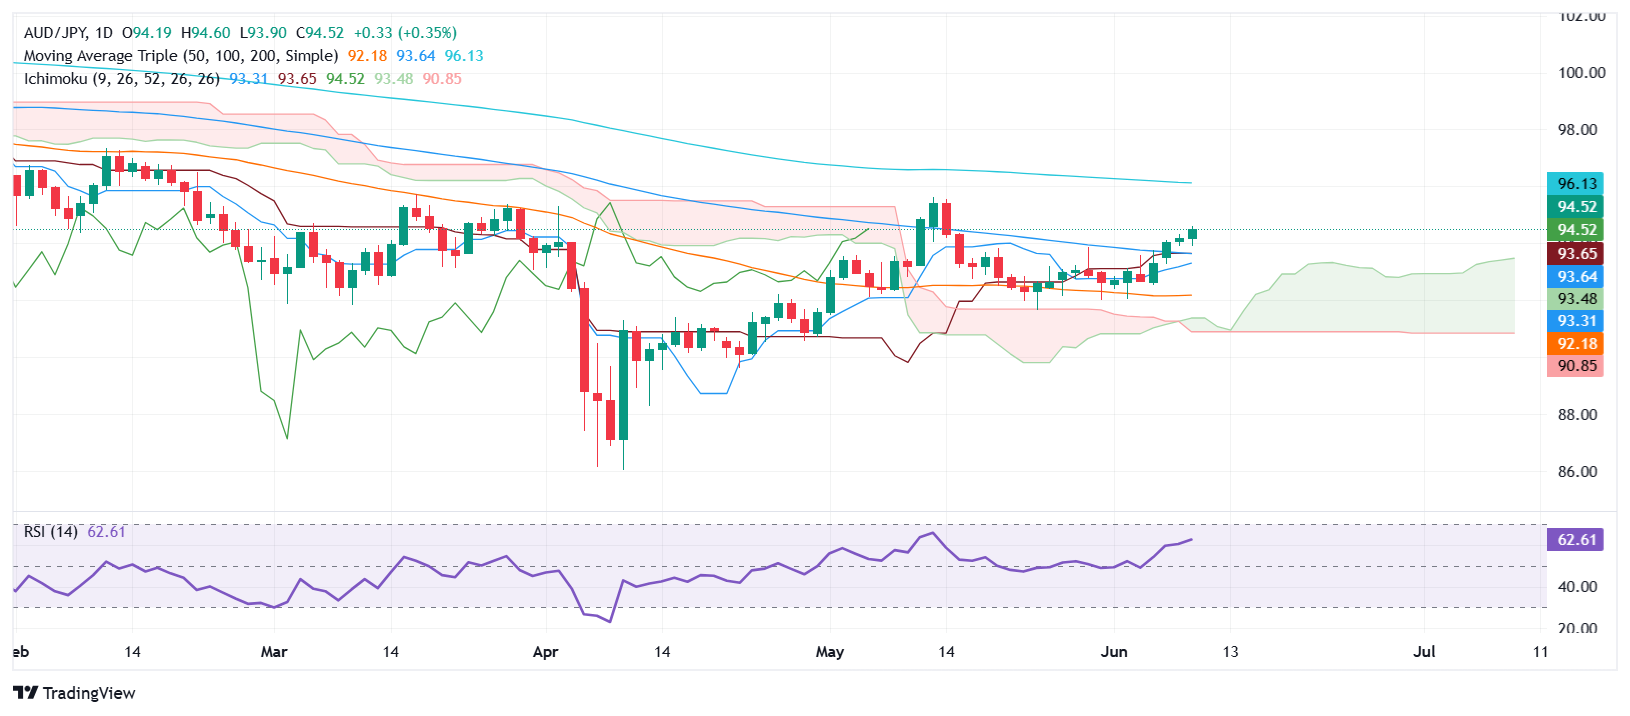
AUD/JPY Price Forecast: Technical outlook

AUD/JPY appears to be testing a downslope resistance trendline drawn from the November 2024 highs, which intersects the May 13 high of 95.63, and buyers seem poised to clear it. It should be noted that the Relative Strength Index (RSI) is bullish and trending upward, indicating that buyers are gaining momentum.

If bulls clear the 95.00 figure, the next area of interest would be the May 13 peak ahead of 96.00. A breach of the latter will expose the February 12 high of 97.32, followed by the 98.00 mark.

On the contrary, a drop below 94.00 exposes the Senkou Span B at 93.46, followed by the Tenkan-sen at 93.29 ahead of 93.00.

AUD/JPY Price Chart – Daily


Australian Dollar PRICE This week

The table below shows the percentage change of Australian Dollar (AUD) against listed major currencies this week. Australian Dollar was the strongest against the British Pound.

USD EUR GBP JPY CAD AUD NZD CHF
USD -0.28% 0.19% 0.00% -0.16% -0.42% -0.56% 0.11%
EUR 0.28% 0.45% 0.26% 0.11% -0.12% -0.30% 0.37%
GBP -0.19% -0.45% -0.12% -0.35% -0.56% -0.75% -0.08%
JPY 0.00% -0.26% 0.12% -0.15% -0.47% -0.62% -0.01%
CAD 0.16% -0.11% 0.35% 0.15% -0.28% -0.41% 0.27%
AUD 0.42% 0.12% 0.56% 0.47% 0.28% -0.18% 0.50%
NZD 0.56% 0.30% 0.75% 0.62% 0.41% 0.18% 0.68%
CHF -0.11% -0.37% 0.08% 0.00% -0.27% -0.50% -0.68%

The heat map shows percentage changes of major currencies against each other. The base currency is picked from the left column, while the quote currency is picked from the top row. For example, if you pick the Australian Dollar from the left column and move along the horizontal line to the US Dollar, the percentage change displayed in the box will represent AUD (base)/USD (quote).

Share: Feed news

Information on these pages contains forward-looking statements that involve risks and uncertainties. Markets and instruments profiled on this page are for informational purposes only and should not in any way come across as a recommendation to buy or sell in these assets. You should do your own thorough research before making any investment decisions. FXStreet does not in any way guarantee that this information is free from mistakes, errors, or material misstatements. It also does not guarantee that this information is of a timely nature. Investing in Open Markets involves a great deal of risk, including the loss of all or a portion of your investment, as well as emotional distress. All risks, losses and costs associated with investing, including total loss of principal, are your responsibility. The views and opinions expressed in this article are those of the authors and do not necessarily reflect the official policy or position of FXStreet nor its advertisers. The author will not be held responsible for information that is found at the end of links posted on this page.

If not otherwise explicitly mentioned in the body of the article, at the time of writing, the author has no position in any stock mentioned in this article and no business relationship with any company mentioned. The author has not received compensation for writing this article, other than from FXStreet.

FXStreet and the author do not provide personalized recommendations. The author makes no representations as to the accuracy, completeness, or suitability of this information. FXStreet and the author will not be liable for any errors, omissions or any losses, injuries or damages arising from this information and its display or use. Errors and omissions excepted.

The author and FXStreet are not registered investment advisors and nothing in this article is intended to be investment advice.

Recommended content


Recommended content

Editors’ Picks

EUR/USD retreats from multi-year tops past 1.1600

EUR/USD retreats from multi-year tops past 1.1600

On Thursday, the EUR/USD extended its uptrend and reached its highest level since November 2021, north of 1.1600 the figure. The marked advance in the pair came in response to the pronounced decline in the US Dollar, aggravated after poor results from the US labour market and softer producer prices.

GBP/USD keeps the bid bias intact around 1.3600

GBP/USD keeps the bid bias intact around 1.3600

Following an initial dip to the 1.3520 zone, the GBP/USD regained traction and traded over the 1.3600 mark on Thursday, building on Wednesday’s gains. The US Dollar (USD) is under heavy selling pressure following weaker inflation data and  disappointing jobless claims number.

Gold remains strong around $3,400

Gold remains strong around $3,400

Gold maintains its weekly rebound well in place, now trading near the $3,400 mark per troy ounce following a strong retracement in the US Dollar, declining US yields across the curve and growing geopolitical tensions.

Cardano Price Forecast: Whales acquire 310 million ADA amid potential triangle breakout

Cardano Price Forecast: Whales acquire 310 million ADA amid potential triangle breakout

Cardano (ADA) shows weakness as it reverses from an overhead trendline of a triangle pattern. The altcoin edges lower by over 1% at press time on Thursday, fueling a steeper correction in its Open Interest. Amid weakness, Cardano whales have acquired 310 million ADA tokens so far this month, projecting increased confidence as the triangle pattern nears resolution. 

US tariffs here to stay, trade deals ‘largely symbolic’

US tariffs here to stay, trade deals ‘largely symbolic’

Despite legal challenges to IEEPA tariffs, US trade policy remains firm. Tariffs on steel and aluminium have doubled, and new sectoral tariffs are expected. Trade deals may emerge, but most will be symbolic. Effective tariff rates will stay high throughout 2025.

The Best brokers to trade EUR/USD

The Best brokers to trade EUR/USD

SPONSORED Discover the top brokers for trading EUR/USD in 2025. Our list features brokers with competitive spreads, fast execution, and powerful platforms. Whether you're a beginner or an expert, find the right partner to navigate the dynamic Forex market.

Forex MAJORS

Cryptocurrencies

Signatures

Best Brokers of 2025