AUD/JPY Price Forecast: Bonces off multi-month low; remains vulnerable near 95.20 area
- AUD/JPY dives to a multi-month low in reaction to Trump’s new trade tariffs.
- Bets for a February RBA rate cut weigh on the Aussie and contribute to the fall.
- The bearish technical setup supports prospects for a further depreciating move.
The AUD/JPY cross attracts heavy selling at the start of a new week and dives to its lowest level since September 2024, around the 94.70-94.65 region during the Asian session. Spot prices, however, trim a part of intraday losses and currently trade near the 95.20 area, still down 1.20% for the day.
US President Donald Trump imposed tariffs on imports from Canada, Mexico, and China, fueling concerns about a global trade war. This, in turn, tempers investors' appetite for riskier assets, which benefits the Japanese Yen's (JPY) relative safe-haven status against the perceived riskier Australian Dollar (AUD). Apart from this, rising bets for a rate cut by the Reserve Bank of Australia (RBA) later this month contribute to the AUD/JPY pair's downfall.
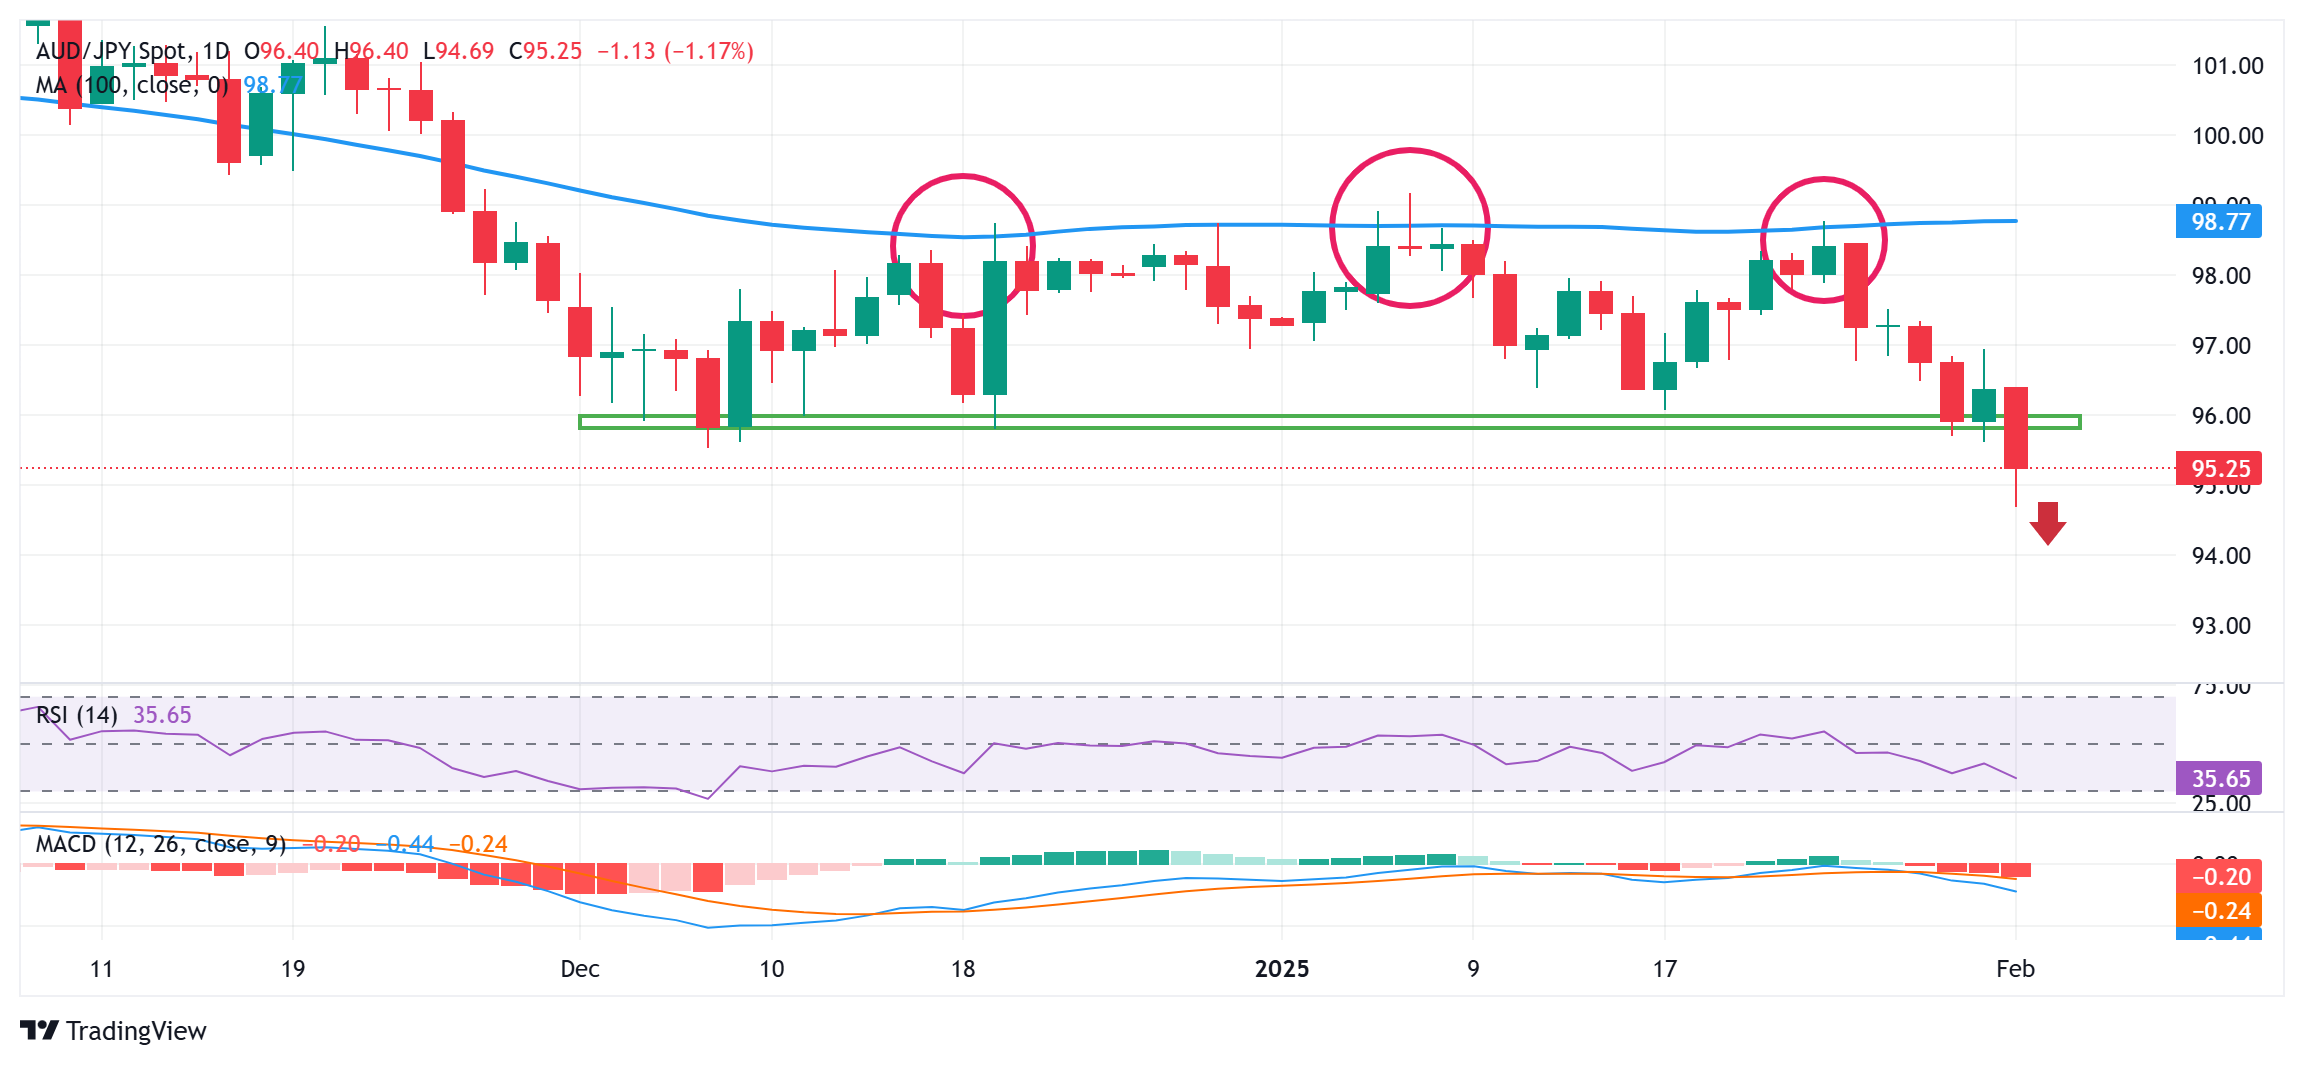
From a technical perspective, the recent repeated failures near the 100-day Simple Moving Average (SMA) constituted the formation of multiple tops on the daily chart. A subsequent breakdown below the 96.00-95.90 horizontal support validates the bearish setup and supports prospects for deeper losses. Moreover, bearish oscillators on the daily chart suggest that the path of least resistance for the AUD/JPY cross remains to the downside.
That said, it will still be prudent to wait for some follow-through selling below the daily low, around the 94.70-94.65 area, before positioning for an extension of over a one-week-old downtrend. The AUD/JPY cross might then accelerate the slide towards the 94.00 round figure en route to the September 2024 trough, around the 93.55-93.50 region.
On the flip side, the 95.65-95.70 area now seems to act as an immediate hurdle ahead of the 96.00 mark. Any further move up beyond the 96.25 hurdle could be seen as a selling opportunity and runs the risk of fizzling out rather quickly ahead of the 97.00 round figure. The latter should act as a key pivotal point, which if cleared could trigger a short-covering rally and lift the AUD/JPY cross beyond the 97.20 resistance, towards 97.55-97.60 horizontal resistance.
AUD/JPY daily chart
US-China Trade War FAQs
Generally speaking, a trade war is an economic conflict between two or more countries due to extreme protectionism on one end. It implies the creation of trade barriers, such as tariffs, which result in counter-barriers, escalating import costs, and hence the cost of living.
An economic conflict between the United States (US) and China began early in 2018, when President Donald Trump set trade barriers on China, claiming unfair commercial practices and intellectual property theft from the Asian giant. China took retaliatory action, imposing tariffs on multiple US goods, such as automobiles and soybeans. Tensions escalated until the two countries signed the US-China Phase One trade deal in January 2020. The agreement required structural reforms and other changes to China’s economic and trade regime and pretended to restore stability and trust between the two nations. However, the Coronavirus pandemic took the focus out of the conflict. Yet, it is worth mentioning that President Joe Biden, who took office after Trump, kept tariffs in place and even added some additional levies.
The return of Donald Trump to the White House as the 47th US President has sparked a fresh wave of tensions between the two countries. During the 2024 election campaign, Trump pledged to impose 60% tariffs on China once he returned to office, which he did on January 20, 2025. With Trump back, the US-China trade war is meant to resume where it was left, with tit-for-tat policies affecting the global economic landscape amid disruptions in global supply chains, resulting in a reduction in spending, particularly investment, and directly feeding into the Consumer Price Index inflation.
Author

Haresh Menghani
FXStreet
Haresh Menghani is a detail-oriented professional with 10+ years of extensive experience in analysing the global financial markets.


