|

AUD/JPY Price Analysis: To face downward pressure, as bearish harami emerges

  • AUD/JPY trendline suggests a neutral to downward bias as the pair struggles to break the Kijun-Sen line at 95.32.
  • Bearish harami formation with a hanging man indicates potential sellers' momentum, heightening the pullback risk.
  • Mixed oscillators and bearish technical indicators, including a bearish Chikou Span, hint at potential AUD/JPY losses in the near term.

AUD/JPY registers minuscule losses of 0.07% after touching a daily low of 94.86, but a late risk-on impulse boosted the Australian Dollar (AUD) toward the current exchange rate. The AUD/JPY is trading at 95.30, down 0.05%.

AUD/JPY Price Analysis: Technical outlook

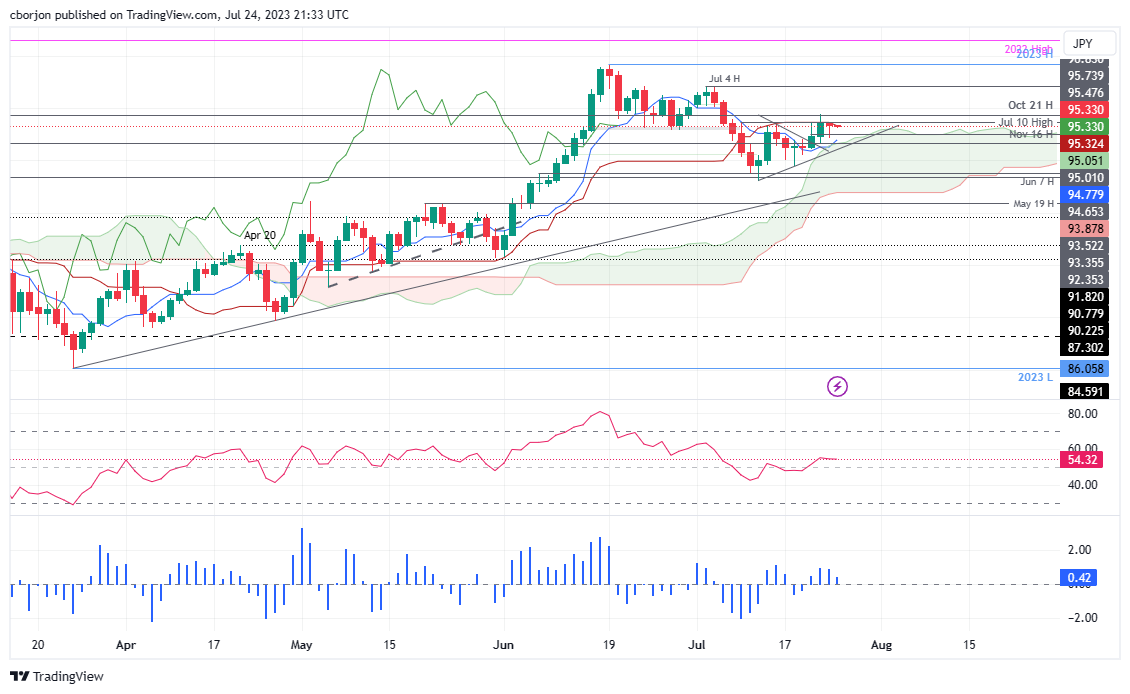
In the near term, the outlook for the AUD/JPY is neutral to downward biased after the pair struggled to break above the Kijun-Sen line at 95.32 for the last couple of days. Aldo, a formation of a bearish harami with a hanging man, suggests sellers are gathering momentum.

That said, the AUD/JPY first support would be the 95.00 figure, followed by the Tenkan-Sen at 94.78. A breach of those levels would expose the top of the Kuo at 94.50/60, followed by the 94.00 figure.

Conversely, if AUD/JPY reclaims the Kijun-Sen, at 95.32, the next resistance would emerge at the October 21 daily high at 95.7, ahead of challenging the 96.00 mark.

Oscillator-wise, the Relative Strength Index (RSI) portrays the pair as bullish; however, the three-day Rate of Change (RoC) shows buying pressure is waning, opening the door for a pullback.

Hence, technical signals suggest the AUD/JPY might be headed downwards, with the Kijun-Sen standing above the Tenkan-Sen, price action below the former, and the Chikou Span turning bearish; the AUD/JPY is headed downwards. That, alongside mixed oscillators, could pave the way for AUD/JPY  losses.

AUD/JPY Price Action – Daily chart

AUD/JPY Daily chart

AUD/JPY

Overview
Today last price95.36
Today Daily Change-0.08
Today Daily Change %-0.08
Today daily open95.44
 
Trends
Daily SMA2095.29
Daily SMA5094.1
Daily SMA10091.74
Daily SMA20091.92
 
Levels
Previous Daily High95.79
Previous Daily Low94.65
Previous Weekly High95.79
Previous Weekly Low93.78
Previous Monthly High97.68
Previous Monthly Low90.3
Daily Fibonacci 38.2%95.35
Daily Fibonacci 61.8%95.09
Daily Pivot Point S194.8
Daily Pivot Point S294.16
Daily Pivot Point S393.67
Daily Pivot Point R195.94
Daily Pivot Point R296.43
Daily Pivot Point R397.07
 

Author

Christian Borjon Valencia

Christian Borjon began his career as a retail trader in 2010, mainly focused on technical analysis and strategies around it. He started as a swing trader, as he used to work in another industry unrelated to the financial markets.

More from Christian Borjon Valencia
Share:

Markets move fast. We move first.

Orange Juice Newsletter brings you expert driven insights - not headlines. Every day on your inbox.

By subscribing you agree to our Terms and conditions.

Editor's Picks

EUR/USD moves sideways below 1.1800 on Christmas Eve

EUR/USD struggles to find direction and trades in a narrow channel below 1.1800 after posting gains for two consecutive days. Bond and stock markets in the US will open at the usual time and close early on Christmas Eve, allowing the trading action to remain subdued. 

GBP/USD keeps range around 1.3500 amid quiet markets

GBP/USD keeps its range trade intact at around 1.3500 on Wednesday. The Pound Sterling holds the upper hand over the US Dollar amid pre-Christmas light trading as traders move to the sidelines heading into the holiday season. 

Gold retreats from record highs, trades below $4,500

Gold retreats after setting a new record-high above $4,520 earlier in the day and trades in a tight range below $4,500 as trading volumes thin out ahead of the Christmas break. The US Dollar selling bias remains unabated on the back of dovish Fed expectations, which continues to act as a tailwind for the bullion amid persistent geopolitical risks.

Bitcoin slips below $87,000 as ETF outflows intensify, whale participation declines

Bitcoin price continues to trade around $86,770 on Wednesday, after failing to break above the $90,000 resistance. US-listed spot ETFs record an outflow of $188.64 million on Tuesday, marking the fourth consecutive day of withdrawals.

Economic outlook 2026-2027 in advanced countries: Solidity test

After a year marked by global economic resilience and ending on a note of optimism, 2026 looks promising and could be a year of solid economic performance. In our baseline scenario, we expect most of the supportive factors at work in 2025 to continue to play a role in 2026.

Avalanche struggles near $12 as Grayscale files updated form for ETF

Avalanche trades close to $12 by press time on Wednesday, extending the nearly 2% drop from the previous day. Grayscale filed an updated form to convert its Avalanche-focused Trust into an ETF with the US Securities and Exchange Commission.