|

AUD/JPY Price Analysis: Teeters on top of Ichimoku cloud, buyers eye 95.00

  • AUD/JPY trades at 94.58, down 0.11%, as it approaches the Ichimoku Cloud, indicating a possible shift from a neutral to upward bias.
  • First resistance lies at the August 30 high of 95.06, followed by the July 31 swing high at 95.83; a ‘bearish-harami’ pattern could signal a downside.
  • Immediate support is at the August 30 low of 94.17, with a breach potentially exposing the Senkou-Span A at 93.87 and the August 21 low of 92.83.

The Australian Dollar (AUD) registers minuscule losses vs. the Japanese Yen (JPY) as Thursday’s Asian session begins and is threatening to break above the Ichimoku Cloud (Kumo), which would open the door for further upside. At the time of writing, the AUD/JPY is trading at 94.58, down 0.11%.

AUD/JPY Price Analysis: Technical outlook

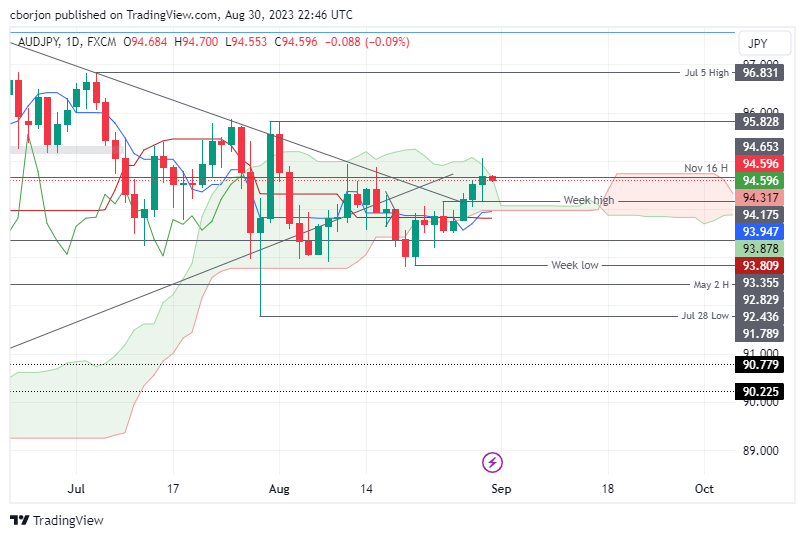
The cross-currency pair daily chart portrays the par as neutral to downward biased, but it could shift to neutral if the AUD/JPY clears the top of the Kumo. In that event, the first resistance to test would be the August 30 high of 95.06, followed by the July 31 swing high at 95.83. Nevertheless, as the AUD/JPY formed a spinning top, price action could remain trapped within Wednesday’s high and low. If that scenario is about to play out, the pair could create a ‘bearish-harami’ candlestick pattern, which could pave the way for further losses.

In that event, the first support would be the August 30 low of 94.17, followed by the 94.00 figure. A breach of the latter will expose the Senkou-Span A at 93.87, followed by the August 21 low of 92.83.

AUD/JPY Price Action – Daily chart

AUD/JPY

Overview
Today last price94.61
Today Daily Change0.08
Today Daily Change %0.08
Today daily open94.53
 
Trends
Daily SMA2093.82
Daily SMA5094.7
Daily SMA10093.18
Daily SMA20091.91
 
Levels
Previous Daily High94.6
Previous Daily Low94.05
Previous Weekly High94.18
Previous Weekly Low92.83
Previous Monthly High96.84
Previous Monthly Low91.79
Daily Fibonacci 38.2%94.39
Daily Fibonacci 61.8%94.26
Daily Pivot Point S194.18
Daily Pivot Point S293.84
Daily Pivot Point S393.63
Daily Pivot Point R194.74
Daily Pivot Point R294.94
Daily Pivot Point R395.29
 

Author

Christian Borjon Valencia

Markets analyst, news editor, and trading instructor with over 14 years of experience across FX, commodities, US equity indices, and global macro markets.

More from Christian Borjon Valencia
Share:

Editor's Picks

EUR/USD seems fragile below 1.1700 as Middle East war boosts energy prices

The EUR/USD pair trades flat at around 1.1680 during the Asian trading session on Tuesday, but broadly seems vulnerable, being close to its five-week low. The major currency pair is under pressure as surging oil prices due to the United States-Israel war with Iran have increased the risks of higher inflation for the Old Continent.

GBP/USD hovers around 1.3400 with bearish pressure intact

GBP/USD edges higher after three days of losses, trading around 1.3400 during the Asian hours on Tuesday. The technical analysis of the daily chart indicates an ongoing bearish bias, as the pair trades within a descending channel pattern.

Gold stays bullish as Iran war continues to spur safe-haven flows

Gold is finding renewed bids in Asian trades on Tuesday, making another attempt to regain the $5,400 level amid persistent demand for safe-haven assets as the Iran war extends. A softer risk tone remains in play as US President Donald Trump continues to threaten deeper escalation to the ongoing war with Iran, warning that a “big wave” is yet to come.

Top Crypto Gainers: Near Protocol, Virtuals Protocol, and Morpho lead market recovery

Near Protocol, Virtuals Protocol, and Morpho are leading the market recovery with double-digit gains over the last 24 hours. Technically, NEAR extends the breakout of the falling channel pattern, VIRTUAL holds above the 50-day EMA, while MORPHO tests a crucial resistance. 

The market is not panicking it is repricing the probability distribution of Oil and time

At the end of the day, markets do not trade morality or geopolitics. They trade transmission channels. And the only channel that truly matters in this maelstrom runs through the price of energy and the time value of money.

Grass 20% bullish breakout defies broader market weakness

Grass (GRASS) is edging up above $0.30 at the time of writing on Monday. The token’s notable 20% intraday surge stands out amid heightened volatility in the broader crypto market.