• AUD/JPY dropped on Wednesday, courtesy of a dampened market sentiment.
  • The AUD/JPY daily chart shifted from upwards to neutral biased as the pair fell below the 20-day EMA and reached fresh weekly lows.
  • Short term, the AUD/JPY is downward biased; it could fall below 95.00 if it clears the 200-EMA on the downside.

The AUD/JPY is slightly advancing as the Asian Pacific session begins after the US Federal Reserve decided to raise rates as widely expected. Nevertheless, on Wednesday, the cross-currency dropped by 0.62% as market sentiment shifted sour, as market participants sought safe-haven assets, meaning the US dollar and the Japanese yen. At the time of writing, the AUD/JPY is trading at 95.56.

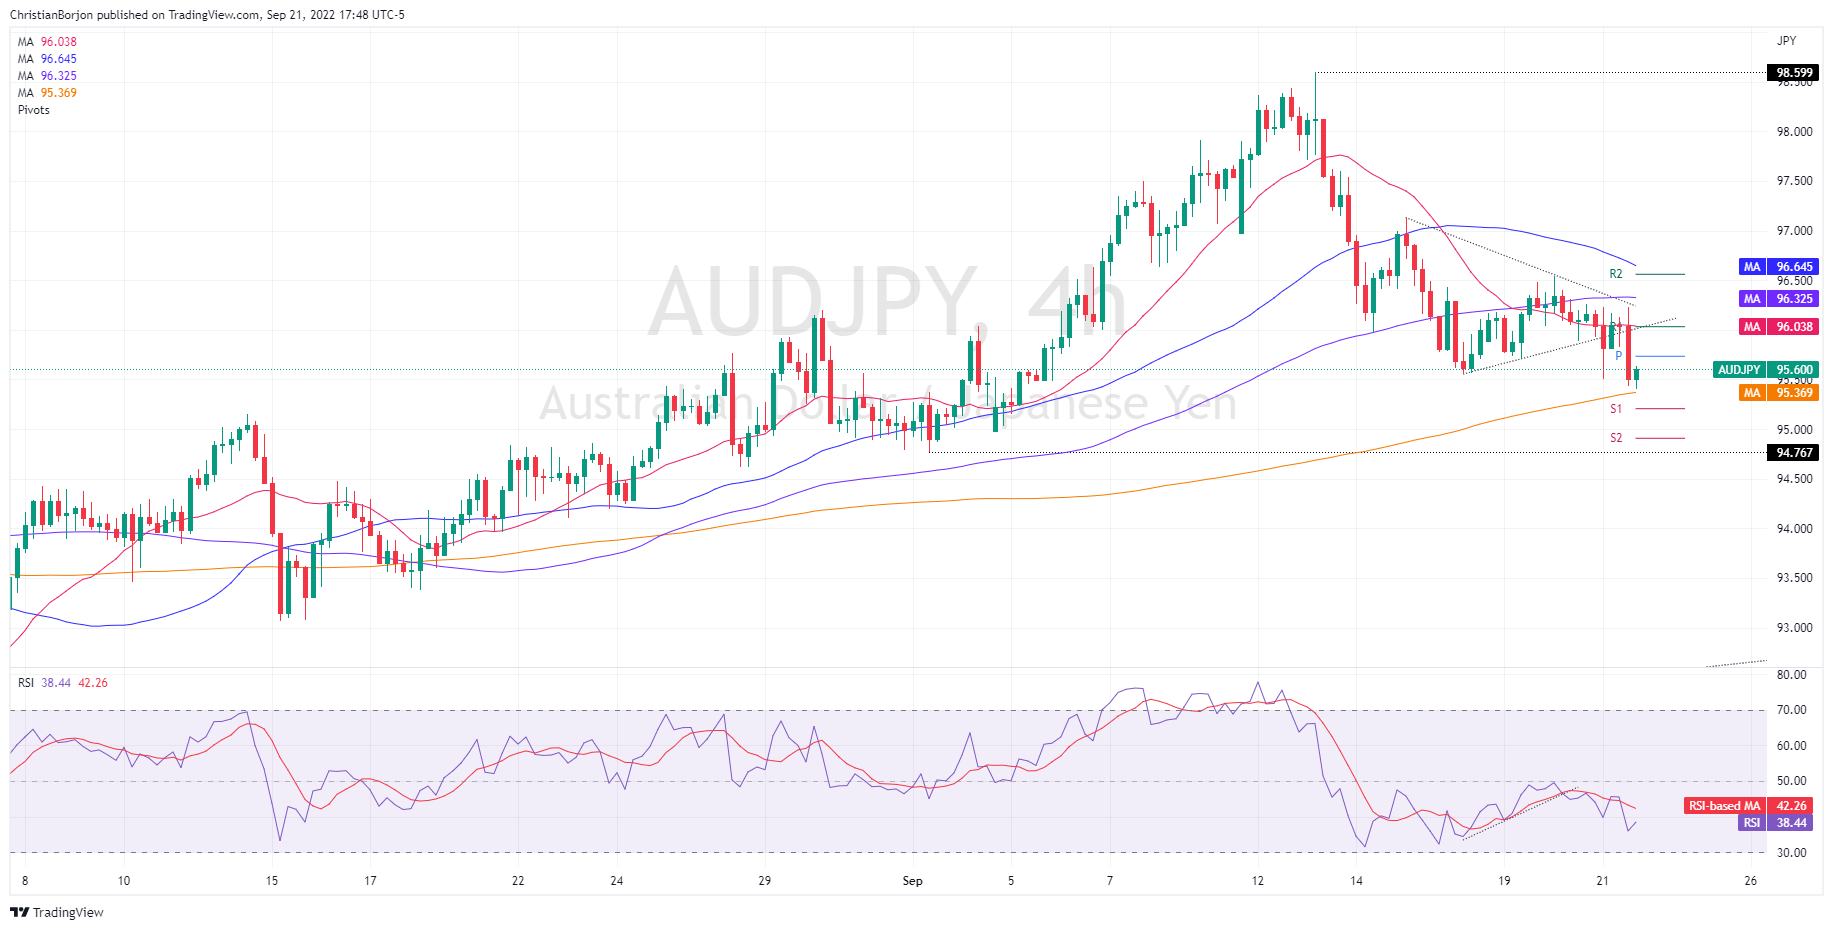
AUD/JPY Price Analysis: Technical outlook

The AUD/JPY daily chart delineated the pair sliding below the 20-day EMA, hitting fresh weekly lows at 95.40. That said, the pair bias shifted from upward biased to neutral as sellers began gathering momentum, as shown by the Relative Strength Index (RSI) crossing below the 50-midline into bearish territory. Therefore, an extension towards fresh weekly lows on the AUD/JPY is on the cards.

Near term, the AUD/JPY is downward biased, as portrayed by the four-hour chart. Higher rates in the US spurred a sell-off in US equities, meaning that flows seeking safety are increasing. Therefore, the AUD/JPY could be headed to the downside due to the Japanese yen's safe-haven status, opening the door for a test of the 200-EMA.

Hence, the AUD/JPY first support would be the 200-EMA at 95.37. Break below will expose the S1 daily pivot at 95.20, followed by the S2 pivot point at 94.91, and then a challenge of the September 2022 low at 94.76.

AUD/JPY Key Technical Levels


Overview
Today last price 95.56
Today Daily Change -0.57
Today Daily Change % -0.59
Today daily open 96.13
 
Trends
Daily SMA20 96.11
Daily SMA50 94.88
Daily SMA100 93.72
Daily SMA200 89.89
 
Levels
Previous Daily High 96.54
Previous Daily Low 95.89
Previous Weekly High 98.58
Previous Weekly Low 95.55
Previous Monthly High 96.2
Previous Monthly Low 90.52
Daily Fibonacci 38.2% 96.14
Daily Fibonacci 61.8% 96.3
Daily Pivot Point S1 95.83
Daily Pivot Point S2 95.54
Daily Pivot Point S3 95.18
Daily Pivot Point R1 96.49
Daily Pivot Point R2 96.84
Daily Pivot Point R3 97.14


Share: Feed news

Information on these pages contains forward-looking statements that involve risks and uncertainties. Markets and instruments profiled on this page are for informational purposes only and should not in any way come across as a recommendation to buy or sell in these assets. You should do your own thorough research before making any investment decisions. FXStreet does not in any way guarantee that this information is free from mistakes, errors, or material misstatements. It also does not guarantee that this information is of a timely nature. Investing in Open Markets involves a great deal of risk, including the loss of all or a portion of your investment, as well as emotional distress. All risks, losses and costs associated with investing, including total loss of principal, are your responsibility. The views and opinions expressed in this article are those of the authors and do not necessarily reflect the official policy or position of FXStreet nor its advertisers. The author will not be held responsible for information that is found at the end of links posted on this page.

If not otherwise explicitly mentioned in the body of the article, at the time of writing, the author has no position in any stock mentioned in this article and no business relationship with any company mentioned. The author has not received compensation for writing this article, other than from FXStreet.

FXStreet and the author do not provide personalized recommendations. The author makes no representations as to the accuracy, completeness, or suitability of this information. FXStreet and the author will not be liable for any errors, omissions or any losses, injuries or damages arising from this information and its display or use. Errors and omissions excepted.

The author and FXStreet are not registered investment advisors and nothing in this article is intended to be investment advice.

Recommended content


Recommended content

Editors’ Picks

AUD/USD hovers around 0.6500 amid light trading, ahead of US GDP

AUD/USD hovers around 0.6500 amid light trading, ahead of US GDP

AUD/USD is trading close to 0.6500 in Asian trading on Thursday, lacking a clear directional impetus amid an Anzac Day holiday in Australia. Meanwhile, traders stay cautious due ti risk-aversion and ahead of the key US Q1 GDP release. 

AUD/USD News

USD/JPY finds its highest bids since 1990, near 155.50

USD/JPY finds its highest bids since 1990, near 155.50

USD/JPY keeps breaking into its highest chart territory since June of 1990 early Thursday, testing 155.50 for the first time in 34 years as the Japanese Yen remains vulnerable, despite looming Japanese intervention risks. Focus shifts to Thursday's US GDP report and the BoJ decision on Friday. 

USD/JPY News

Gold price treads water near $2,320, awaits US GDP data

Gold price treads water near $2,320, awaits US GDP data

Gold price recovers losses but keeps its range near $2,320 early Thursday. Renewed weakness in the US Dollar and the US Treasury yields allow Gold buyers to breathe a sigh of relief. Gold price stays vulnerable amid Middle East de-escalation, awaiting US Q1 GDP data. 

Gold News

Injective price weakness persists despite over 5.9 million INJ tokens burned

Injective price weakness persists despite over 5.9 million INJ tokens burned

Injective price is trading with a bearish bias, stuck in the lower section of the market range. The bearish outlook abounds despite the network's deflationary efforts to pump the price. Coupled with broader market gloom, INJ token’s doomed days may not be over yet.

Read more

Meta Platforms Earnings: META sinks 10% on lower Q2 revenue guidance Premium

Meta Platforms Earnings: META sinks 10% on lower Q2 revenue guidance

This must be "opposites" week. While Doppelganger Tesla rode horrible misses on Tuesday to a double-digit rally, Meta Platforms produced impressive beats above Wall Street consensus after the close on Wednesday, only to watch the share price collapse by nearly 10%.

Read more

Forex MAJORS

Cryptocurrencies

Signatures