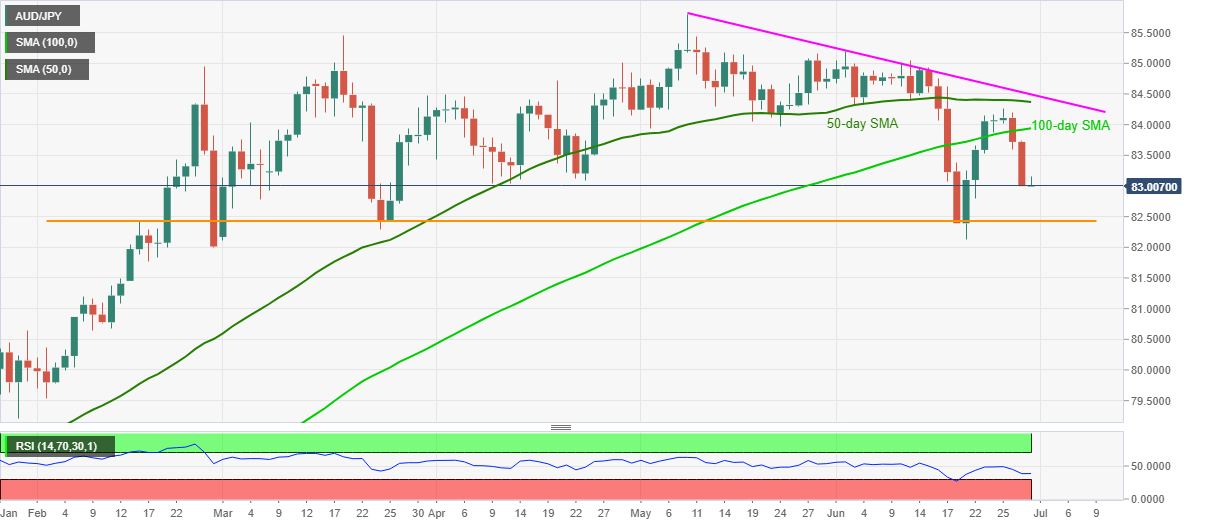
AUD/JPY Price Analysis: Stays directed to 82.40 after China PMI


  • AUD/JPY reverses early Asian corrective pullback near weekly low.
  • Downbeat RSI, sustained trading below key SMAs keep sellers hopeful.
  • 3.5-month-old horizontal support will be a tough nut to break for the bears.

AUD/JPY extends pullback from intraday high, reversing early day gains, to retest the 83.00 threshold during early Wednesday. In doing so, the cross-currency pair reacts to the latest China PMIs for June while directing the SMA breakdowns toward crucial support.

China’s headline NBS Manufacturing PMI crossed 50.8 forecast to 50.9 but lagged behind the 51.00 prior in June while the Non-Manufacturing PMI stayed below 55.2 prior despite crossing 52.7 market consensus with 53.5 readings.

Read: Chinese PMIs beat estimates but are below priors

Given the downward sloping RSI joining the AUD/JPY pair’s sustained weakness below 50-day and 100-day SMA, the quote is well set to revisit horizontal support from mid-February near 82.40.

Even if likely oversold conditions of RSI may challenge the pair’s further weakness past 82.40, the monthly low of 82.13 and the 82.00 round figure, not to forget the February 17 swing low near 81.75, will lure the bears afterward.

Alternatively, 100-day SMA near 83.95 and the latest swing high near 84.25, quickly followed by a 50-day SMA level of 84.37 could restrict the quote’s short-term recovery moves.

It’s worth noting that a downward sloping trend line from May 10, near 84.50, becomes a crucial upside barrier during the AUD/JPY recovery, a break of which should recall the bulls targeting the monthly top of 85.20.

AUD/JPY daily chart

Trend: Further downside expected

Additional important levels

Overview
Today last price 83.02
Today Daily Change 0.02
Today Daily Change % 0.02%
Today daily open 83
 
Trends
Daily SMA20 84.14
Daily SMA50 84.39
Daily SMA100 83.92
Daily SMA200 80.65
 
Levels
Previous Daily High 83.74
Previous Daily Low 83
Previous Weekly High 84.26
Previous Weekly Low 82.14
Previous Monthly High 85.8
Previous Monthly Low 83.93
Daily Fibonacci 38.2% 83.28
Daily Fibonacci 61.8% 83.45
Daily Pivot Point S1 82.75
Daily Pivot Point S2 82.5
Daily Pivot Point S3 82.01
Daily Pivot Point R1 83.49
Daily Pivot Point R2 83.98
Daily Pivot Point R3 84.23


Share: Feed news

Information on these pages contains forward-looking statements that involve risks and uncertainties. Markets and instruments profiled on this page are for informational purposes only and should not in any way come across as a recommendation to buy or sell in these assets. You should do your own thorough research before making any investment decisions. FXStreet does not in any way guarantee that this information is free from mistakes, errors, or material misstatements. It also does not guarantee that this information is of a timely nature. Investing in Open Markets involves a great deal of risk, including the loss of all or a portion of your investment, as well as emotional distress. All risks, losses and costs associated with investing, including total loss of principal, are your responsibility. The views and opinions expressed in this article are those of the authors and do not necessarily reflect the official policy or position of FXStreet nor its advertisers. The author will not be held responsible for information that is found at the end of links posted on this page.

If not otherwise explicitly mentioned in the body of the article, at the time of writing, the author has no position in any stock mentioned in this article and no business relationship with any company mentioned. The author has not received compensation for writing this article, other than from FXStreet.

FXStreet and the author do not provide personalized recommendations. The author makes no representations as to the accuracy, completeness, or suitability of this information. FXStreet and the author will not be liable for any errors, omissions or any losses, injuries or damages arising from this information and its display or use. Errors and omissions excepted.

The author and FXStreet are not registered investment advisors and nothing in this article is intended to be investment advice.

Recommended content


Recommended content

Editors’ Picks

EUR/USD retreats below 1.0700 after US GDP data

EUR/USD retreats below 1.0700 after US GDP data

EUR/USD came under modest bearish pressure and retreated below 1.0700. Although the US data showed that the economy grew at a softer pace than expected in Q1, strong inflation-related details provided a boost to the USD.

EUR/USD News

GBP/USD declines below 1.2500 as USD rebounds

GBP/USD declines below 1.2500 as USD rebounds

GBP/USD declined below 1.2500 and erased the majority of its daily gains with the immediate reaction to the US GDP report. The US economy expanded at a softer pace than expected in Q1 but the price deflator jumped to 3.4% from 1.8%. 

GBP/USD News

Gold drops below $2,320 as US yields shoot higher

Gold drops below $2,320 as US yields shoot higher

Gold lost its traction and turned negative on the day below $2,320 in the American session on Thursday. The benchmark 10-year US Treasury bond yield is up more than 1% on the day above 4.7% after US GDP report, weighing on XAU/USD.

Gold News

XRP extends its decline, crypto experts comment on Ripple stablecoin and benefits for XRP Ledger

XRP extends its decline, crypto experts comment on Ripple stablecoin and benefits for XRP Ledger

Ripple extends decline to $0.52 on Thursday, wipes out weekly gains. Crypto expert asks Ripple CTO how the stablecoin will benefit the XRP Ledger and native token XRP. 

Read more

After the US close, it’s the Tokyo CPI

After the US close, it’s the Tokyo CPI

After the US close, it’s the Tokyo CPI, a reliable indicator of the national number and then the BoJ policy announcement. Tokyo CPI ex food and energy in Japan was a rise to 2.90% in March from 2.50%.

Read more

Forex MAJORS

Cryptocurrencies

Signatures