|

AUD/JPY Price Analysis: Prices tumble below the 1-hour Kumo; further downside expected

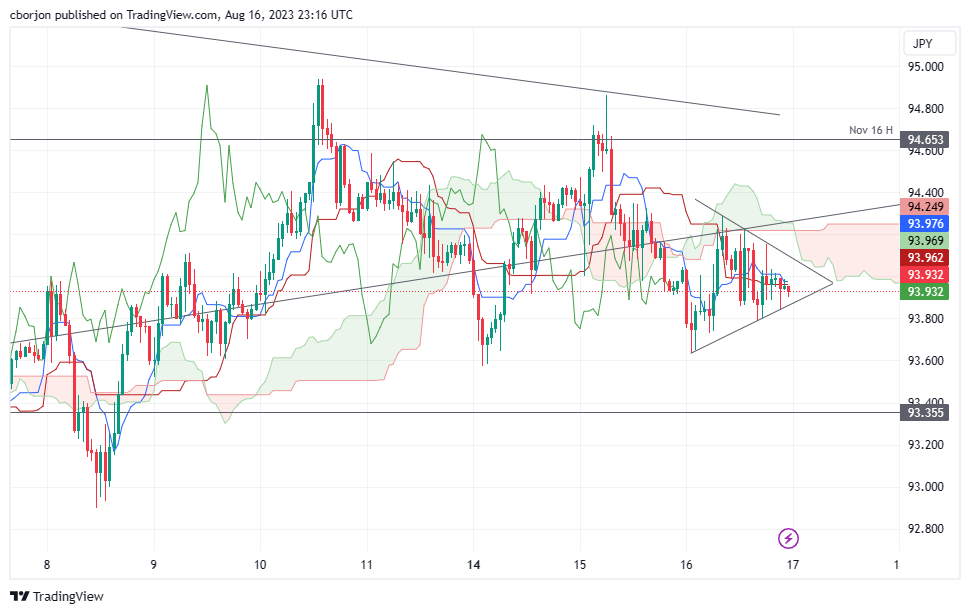
  • AUD/JPY trades near the week’s lows, with a potential move toward the bottom of the Ichimoku Cloud (Kumo).
  • Tenkan and Kijun-Sen lines set immediate resistance levels at 93.95 and 93.97, respectively.
  • Descending triangle formation on the hourly chart suggests potential for further downside.
  • AUD/JPY key support levels to watch: 93.79, 93.63, and 92.89.

AUD/JPY sits near the week’s lows and threatens to extend its losses toward the bottom of the Ichimoku Cloud (Kumo) as Thursday’s Asian session begins. At the time of writing, the AUD/JPY is exchanging hands at 93.97, registering minuscule losses of 0.03%.

AUD/JPY Price Analysis: Technical outlook

The AUD/JPY daily chart portrays the pair neutral-bearish, set to stay within the Kumo amid the lack of a catalyst that could trigger a downward break. The AUD/JPY remains in a  downward mode after achieving successive series of lower highs and lower lows, seeing as a sign of a downtrend. Unless buyers reclaim the July 31 daily high of 95.82, the AUD/JPY pair could test the bottom of the Kumo at 93.40.

Short term, the AUD/JPY hourly chart portrays the pair as bearish biased, as price action lies below the Kumo. In addition, the Tenkan and Kijun-Sen lines lie above the spot price, acting as resistance levels, each at 93.95 and 93.97.

Nevertheless, from a pure price action point of view, the AUD/JPY is forming a descending triangle, which could pave the way for further losses. A breach of the bottom trendline will expose 93.79 as the first support, followed by the August 16 daily low of 93.63. Once those levels are cleared, the next support would emerge at an August 8 daily low of 92.89.

AUD/JPY Price Action – Hourly chart

AUD/JPY

Overview
Today last price93.96
Today Daily Change0.00
Today Daily Change %0.00
Today daily open93.96
 
Trends
Daily SMA2094.35
Daily SMA5094.98
Daily SMA10092.67
Daily SMA20091.91
 
Levels
Previous Daily High94.87
Previous Daily Low93.93
Previous Weekly High94.94
Previous Weekly Low92.9
Previous Monthly High96.84
Previous Monthly Low91.79
Daily Fibonacci 38.2%94.29
Daily Fibonacci 61.8%94.51
Daily Pivot Point S193.64
Daily Pivot Point S293.31
Daily Pivot Point S392.7
Daily Pivot Point R194.58
Daily Pivot Point R295.2
Daily Pivot Point R395.52

Author

Christian Borjon Valencia

Christian Borjon began his career as a retail trader in 2010, mainly focused on technical analysis and strategies around it. He started as a swing trader, as he used to work in another industry unrelated to the financial markets.

More from Christian Borjon Valencia
Share:

Markets move fast. We move first.

Orange Juice Newsletter brings you expert driven insights - not headlines. Every day on your inbox.

By subscribing you agree to our Terms and conditions.

Editor's Picks

EUR/USD struggles for direction amid USD gains

EUR/USD is trimming part of its earlier gains, coming under some mild downside pressure near 1.1730 as the US Dollar edges higher. Markets are still digesting the Fed’s latest rate decision, while also looking ahead to more commentary from Fed officials in the sessions ahead.

GBP/USD drops to daily lows near 1.3360

Disappointing UK data weighed on the Sterling towards the end of the week, triggering a pullback in GBP/USD to fresh daily lows near 1.3360. Looking ahead, the next key event across the Channel is the BoE meeting on December 18.

Gold losses momentum, challenges $4,300

Gold now gives away some gains and disputes the key $4,300 zone per troy ounce following earlier multi-week highs. The move is being driven by expectations that the Fed will deliver further rate cuts next year, with the yellow metal climbing despite a firmer Greenback and rising US Treasury yields across the board.

Litecoin Price Forecast: LTC struggles to extend gains, bullish bets at risk

Litecoin (LTC) price steadies above $80 at press time on Friday, following a reversal from the $87 resistance level on Wednesday. Derivatives data suggests a bullish positional buildup while the LTC futures Open Interest declines, flashing a long squeeze risk.

Big week ends with big doubts

The S&P 500 continued to push higher yesterday as the US 2-year yield wavered around the 3.50% mark following a Federal Reserve (Fed) rate cut earlier this week that was ultimately perceived as not that hawkish after all. The cut is especially boosting the non-tech pockets of the market.

Aave Price Forecast: AAVE primed for breakout as bullish signals strengthen

Aave (AAVE) price is trading above $204 at the time of writing on Friday and approaching the upper boundary of its descending parallel channel; a breakout from this structure would favor the bulls.