|

AUD/JPY Price Analysis: Plummets inside the Kumo, extends its losses past 95.00

  • AUD/JPY retraces from 96.06 to 94.67, influenced by central banks' focus on high inflation and a sour market mood.
  • The pair has fallen inside the Ichimoku Cloud, suggesting potential further downside with first support at the Kijun-Sen at 94.43.
  • The short-term outlook is bearish, but an upward correction towards 94.88 is possible before extending losses past 94.53 to 94.00.

The AUD/JPY retraces from weekly highs of 96.06 extended its losses past the 95.00 figure, spurred by a sour market mood, as global central banks remain focused on tackling sticky high inflation. Hence, the pair dropped 1% or 95 pips on Thursday, and as the Asian session commences, it hovers around 94.67 flat.

The daily chart depicts the pair as neutral biased, but the AUD/JPY has fallen inside the Ichimoku Cloud (Kumo), which could open the door for further downside. The cross-currency pair first support would be the Kijun-Sen at 94.43, followed by an upslope support trendline at 94.30. Once cleared, the next support would be the Senkou Span B at 93.93, followed by the bottom of the Kumo at 93.80.

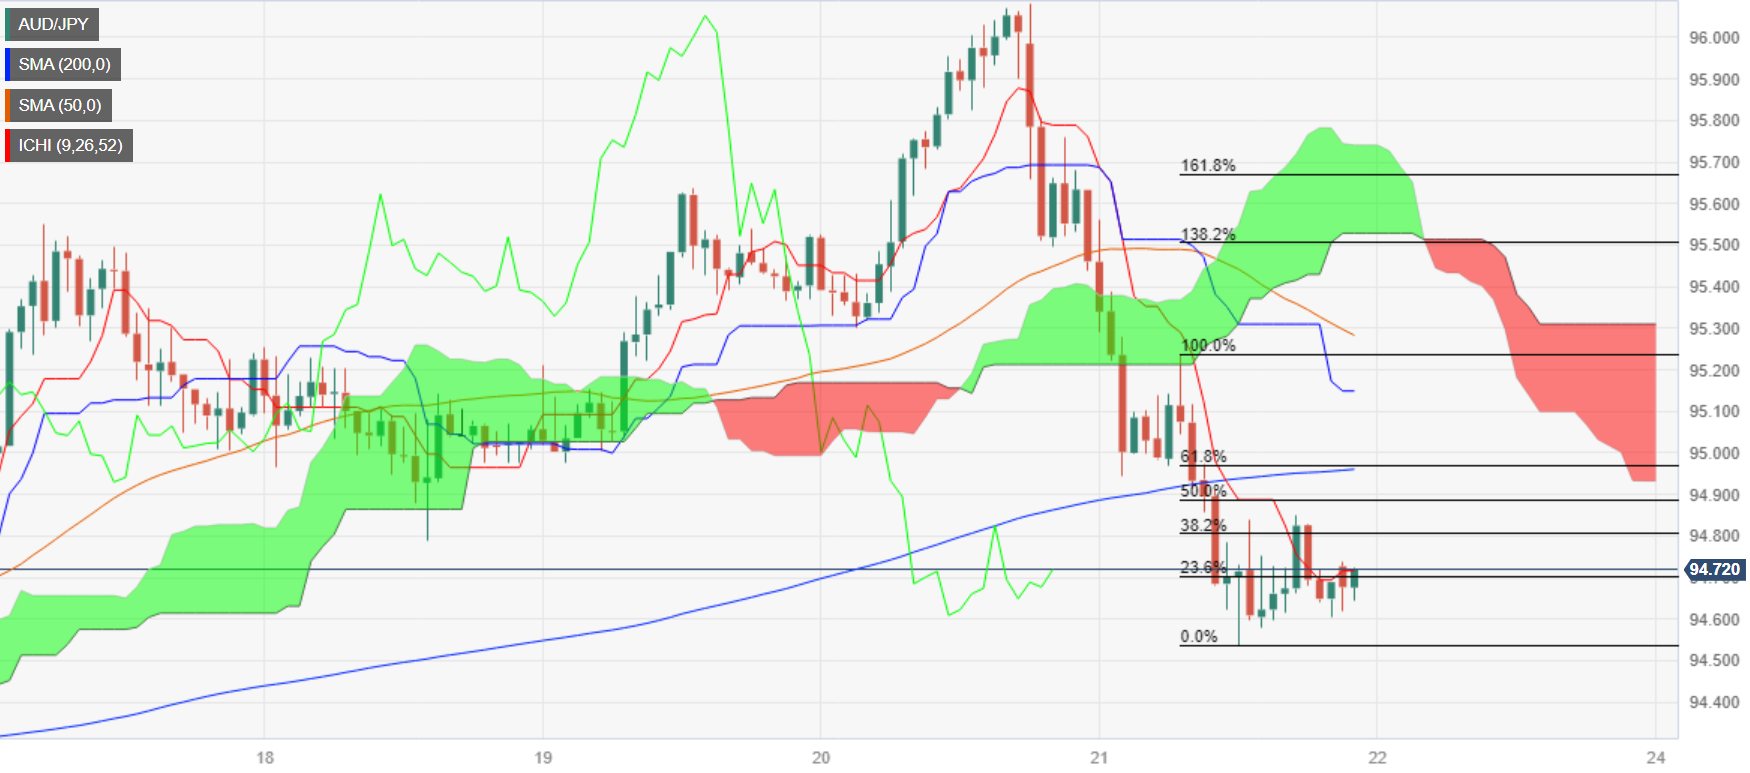
Short-term, the AUD/JPY pair is in a downtrend, below the Kumo, with price action below the Kijun and Tenkan-Sen lines, respectively. At the same time, the Chikou Span is also below the Kumo and price action, meaning the pair is bearish-biased. However, recent price action suggests an upward correction could be on the cards, with the pair set to edge towards the 50% Fibonacci retracement at 94.88. Once reached, the pair could extend its losses past the September 21 low of 94.53, followed by the 94.00 figure.

AUD/JPY Price Action – Hourly chart

AUD/JPY Key Technical Levels

AUD/JPY

Overview
Today last price94.69
Today Daily Change-0.96
Today Daily Change %-1.00
Today daily open95.65
 
Trends
Daily SMA2094.53
Daily SMA5094.37
Daily SMA10093.95
Daily SMA20092.06
 
Levels
Previous Daily High96.08
Previous Daily Low95.3
Previous Weekly High95.55
Previous Weekly Low93.65
Previous Monthly High95.81
Previous Monthly Low92.79
Daily Fibonacci 38.2%95.79
Daily Fibonacci 61.8%95.6
Daily Pivot Point S195.27
Daily Pivot Point S294.9
Daily Pivot Point S394.49
Daily Pivot Point R196.05
Daily Pivot Point R296.46
Daily Pivot Point R396.83

Author

Christian Borjon Valencia

Christian Borjon began his career as a retail trader in 2010, mainly focused on technical analysis and strategies around it. He started as a swing trader, as he used to work in another industry unrelated to the financial markets.

More from Christian Borjon Valencia
Share:

Markets move fast. We move first.

Orange Juice Newsletter brings you expert driven insights - not headlines. Every day on your inbox.

By subscribing you agree to our Terms and conditions.

Editor's Picks

EUR/USD bounces toward 1.1750 as US Dollar loses strength

EUR/USD returned to the 1.1750 price zone in the American session on Friday, despite falling Wall Street, which indicates risk aversion. Trading conditions remain thin following the New Year holiday and ahead of the weekend, with the focus shifting to US employment and European data scheduled for next week.

GBP/USD nears 1.3500, holds within familiar levels

After testing 1.3400 on the last day of 2025, GBP/USD managed to stage a rebound. Nevertheless, the pair finds it difficult to gather momentum and trades with modest intraday gains at around 1.3490 as market participants remain in holiday mood.

Gold trims intraday gains, approaches $4,300

Gold retreated sharply from the $4,400  area and trades flat for the day in the $4,320 price zone. Choppy trading conditions exacerbated the intraday decline, although XAU/USD bearish case is out of the picture, considering growing expectations for a dovish Fed and persistent geopolitical tensions.

Cardano gains early New Year momentum, bulls target falling wedge breakout

Cardano kicks off the New Year on a positive note and is extending gains, trading above $0.36 at the time of writing on Friday. Improving on-chain and derivatives data point to growing bullish interest, while the technical outlook keeps an upside breakout in focus.

Economic outlook 2026-2027 in advanced countries: Solidity test

After a year marked by global economic resilience and ending on a note of optimism, 2026 looks promising and could be a year of solid economic performance. In our baseline scenario, we expect most of the supportive factors at work in 2025 to continue to play a role in 2026.

Crypto market outlook for 2026

Year 2025 was volatile, as crypto often is.  Among positive catalysts were favourable regulatory changes in the U.S., rise of Digital Asset Treasuries (DAT), adoption of AI and tokenization of Real-World-Assets (RWA).