|

AUD/JPY Price Analysis: Drops toward 94.20 area as bearish pressure mounts

  • AUD/JPY was seen near the 94.30 zone on Friday ahead of the Asian session, retreating toward the lower end of its daily range.
  • Despite mixed signals from oscillators, moving averages tilt the broader technical bias to the downside.
  • Support lies near 94.00 and 93.88, while resistance is seen just above 94.40; indicators remain conflicted with bearish lean.

The AUD/JPY pair extended its decline on Friday, hovering near the 94.30 zone after the European session and slipping closer to the lower end of its intraday range. The pair is down notably on the day, reflecting an increase in selling interest. While some momentum indicators remain neutral or even slightly constructive, broader technical signals continue to favor a bearish bias for the near term.

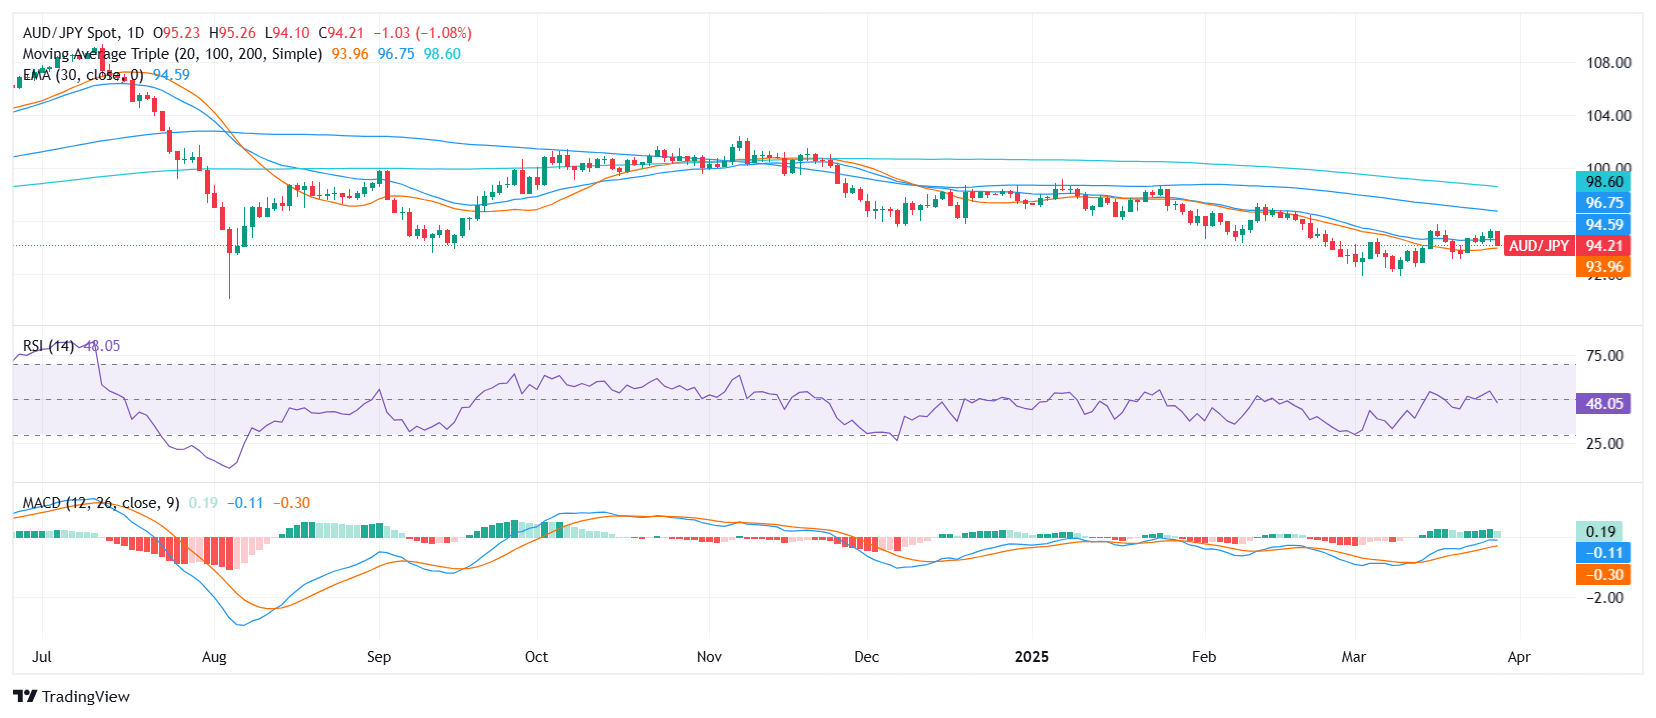
Looking at the indicators, the Relative Strength Index (RSI) fell below 50, yet neutral in tone, while the MACD posts a slight buy signal , hinting at possible short-term correction. However, the Bull Bear Power stands at 0.641, reinforcing the underlying selling pressure, and the Williams Percent Range remains neutral, failing to offer a clear reversal signal.

Moving averages present a split picture. The short-term 20-day Simple Moving Average (SMA) at 94.02 continues to signal a buy, offering dynamic support. However, the 10-day EMA (94.45) and SMA (94.58), along with the 100-day (96.85) and 200-day (98.70) SMAs, all lean bearish, suggesting that upside potential remains capped unless a structural shift occurs.

In terms of levels, immediate support emerges at 94.16, followed by 94.02 and 93.88. On the flip side, resistance is seen around 94.35, 94.42, and 94.45—just ahead of key short-term moving averages that could act as selling zones if bulls attempt to regain control.

AUD/JPY daily chart

Author

Patricio Martín

Patricio is an economist from Argentina passionate about global finance and understanding the daily movements of the markets.

More from Patricio Martín
Share:

Editor's Picks

GBP/USD trades  near daily lows on persistent US Dollar strength

GBP/USD lost traction and declined toward 1.3150 following a short-lasting recovery attempt to the 1.3200 region in the early European session. The pair trades near its low early in the American session as US PCE inflation data came in line with expectations.

EUR/USD remains below 1.1350 after US PCE inflation

EUR/USD struggles to stage a rebound and trades in negative territory below 1.1350 on Thursday. The cautious market stance helps the US Dollar hold its ground and weighs on the pair as market participants assess the US PCE inflation report for May.

Gold struggles to stabilize above $4,000

Gold remains on the back foot, trading around $4,000 on Thursday. The commodity sticks to its bearish bias for the third straight day, and remains close to the lowest level since November 2025, touched on Wednesday.

Bitcoin tests $60,000 as whales sell off – Aave and Jupiter show resilience

The broader cryptocurrency market remains under intense selling pressure, with Bitcoin back at $60,000 for the third time this year. On-chain data shows selling pressure from large-wallet investors, commonly referred to as whales, while total liquidations hit nearly $1 billion in 24 hours.

Bitcoin nears make-or-break level ahead of US PCE data

Bitcoin recovers slightly, trading at $61,700 after reaching a new yearly low of $59,103 and a 21-month low the previous day. This bearish price action is supported by the ongoing institutional sell-off, which recorded an outflow of over $469 million on Wednesday.

Regime change: Inside Kevin Warsh's first move to make the Fed unreadable on purpose

The rate did not move. That was the least interesting thing about Kevin Warsh's first meeting in charge of the Fed. The FOMC held its benchmark at 3.50%-3.75% for the fourth straight meeting, exactly as priced, and then the new chair used his first press conference to dismantle the machinery the market has leaned on for a decade.