AUD/JPY Price Analysis: Corrective pullback approaches 200-HMA after RBA Minutes


  • AUD/JPY extends rebound from 50% Fibonacci retracement level on RBA Minutes.
  • RBA policymakers hint at further rate hikes but signal uncertainty ahead, per the minutes.
  • RSI recovery from oversold territory also favors buyers to aim for the previous support line.
  • Two-week-old horizontal support zone could test bears past 93.10.

AUD/JPY picks up bids to consolidate intraday losses around 93.60 during Tuesday’s Asian session. In doing so, the cross-currency pair tries to cheer cautiously optimistic statements from the Reserve Bank of Australia’s (RBA) Minutes of the latest monetary policy meeting.

RBA Minutes mentioned that the board expects to take further steps in the process of normalizing monetary conditions over the months ahead, but it is not on a pre-set path, per Reuters.

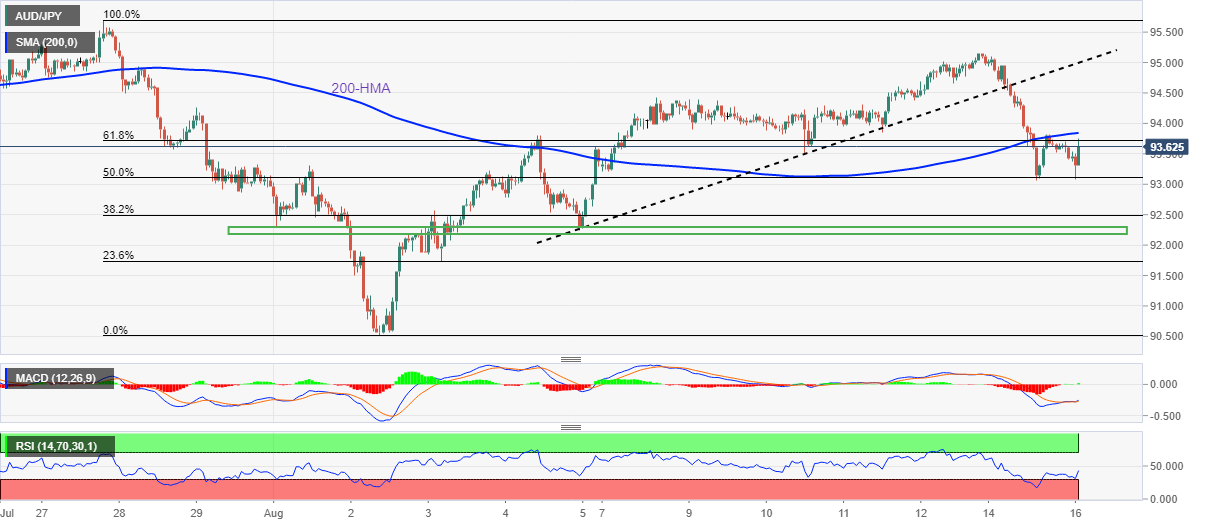
Technically, AUD/JPY rebounds from the 50% Fibonacci retracement level of July 27 to August 02 downturn. The recovery moves also gain support from the RSI (14) as it recovers from the oversold territory.

However, the 200-HMA level surrounding 93.85 restricts the immediate upside of the AUD/JPY pair ahead of the previous support line from August 05, close to the 95.00 threshold at the latest.

On the contrary, a downside break of the 50% Fibonacci retracement level of 93.10 could quickly fetch the AUD/JPY prices toward the fortnight-long horizontal support area near 93.20-30.

AUD/JPY: Hourly chart

Trend: Limited upside expected

Additional important levels

Overview
Today last price 93.66
Today Daily Change 0.03
Today Daily Change % 0.03%
Today daily open 93.63
 
Trends
Daily SMA20 94.08
Daily SMA50 93.86
Daily SMA100 92.97
Daily SMA200 88.1
 
Levels
Previous Daily High 95.09
Previous Daily Low 93.07
Previous Weekly High 95.15
Previous Weekly Low 93.21
Previous Monthly High 95.76
Previous Monthly Low 91.42
Daily Fibonacci 38.2% 93.84
Daily Fibonacci 61.8% 94.32
Daily Pivot Point S1 92.77
Daily Pivot Point S2 91.91
Daily Pivot Point S3 90.74
Daily Pivot Point R1 94.79
Daily Pivot Point R2 95.95
Daily Pivot Point R3 96.82


Share: Feed news

Information on these pages contains forward-looking statements that involve risks and uncertainties. Markets and instruments profiled on this page are for informational purposes only and should not in any way come across as a recommendation to buy or sell in these assets. You should do your own thorough research before making any investment decisions. FXStreet does not in any way guarantee that this information is free from mistakes, errors, or material misstatements. It also does not guarantee that this information is of a timely nature. Investing in Open Markets involves a great deal of risk, including the loss of all or a portion of your investment, as well as emotional distress. All risks, losses and costs associated with investing, including total loss of principal, are your responsibility. The views and opinions expressed in this article are those of the authors and do not necessarily reflect the official policy or position of FXStreet nor its advertisers. The author will not be held responsible for information that is found at the end of links posted on this page.

If not otherwise explicitly mentioned in the body of the article, at the time of writing, the author has no position in any stock mentioned in this article and no business relationship with any company mentioned. The author has not received compensation for writing this article, other than from FXStreet.

FXStreet and the author do not provide personalized recommendations. The author makes no representations as to the accuracy, completeness, or suitability of this information. FXStreet and the author will not be liable for any errors, omissions or any losses, injuries or damages arising from this information and its display or use. Errors and omissions excepted.

The author and FXStreet are not registered investment advisors and nothing in this article is intended to be investment advice.

Recommended content


Recommended content

Editors’ Picks

AUD/USD failed just ahead of the 200-day SMA

AUD/USD failed just ahead of the 200-day SMA

Finally, AUD/USD managed to break above the 0.6500 barrier on Wednesday, extending the weekly recovery, although its advance faltered just ahead of the 0.6530 region, where the key 200-day SMA sits.

AUD/USD News

EUR/USD met some decent resistance above 1.0700

EUR/USD met some decent resistance above 1.0700

EUR/USD remained unable to gather extra upside traction and surpass the 1.0700 hurdle in a convincing fashion on Wednesday, instead giving away part of the weekly gains against the backdrop of a decent bounce in the Dollar.

EUR/USD News

Gold keeps consolidating ahead of US first-tier figures

Gold keeps consolidating ahead of US first-tier figures

Gold finds it difficult to stage a rebound midweek following Monday's sharp decline but manages to hold above $2,300. The benchmark 10-year US Treasury bond yield stays in the green above 4.6% after US data, not allowing the pair to turn north.

Gold News

Bitcoin price could be primed for correction as bearish activity grows near $66K area

Bitcoin price could be primed for correction as bearish activity grows near $66K area

Bitcoin (BTC) price managed to maintain a northbound trajectory after the April 20 halving, despite bold assertions by analysts that the event would be a “sell the news” situation. However, after four days of strength, the tables could be turning as a dark cloud now hovers above BTC price.

Read more

Bank of Japan's predicament: The BOJ is trapped

Bank of Japan's predicament: The BOJ is trapped

In this special edition of TradeGATEHub Live Trading, we're joined by guest speaker Tavi @TaviCosta, who shares his insights on the Bank of Japan's current predicament, stating, 'The BOJ is Trapped.' 

Read more

Forex MAJORS

Cryptocurrencies

Signatures