|

AUD/JPY Price Analysis: Continues to fall, awaits possible correction

  • AUD/JPY continues its dip, reaching a low below 100, the lowest level since April.
  • The short-term bearish trend continues to intensify as the pair records a fifth losing day.
  • The 200-day SMA near 100.00 is the last barrier to avoiding further losses.

In Thursday's session, the AUD/JPY pair extended its decline, with a fall of 0.54% to reach 100.55 and hit a low of 99.22. This affirms the control of the sellers and further solidifies the bearish short-term outlook as the pair hits a new seasonal low.

The daily Relative Strength Index (RSI) pair has decreased to 21, pointing toward an ever-increasing bearish momentum. Along with this, the Moving Average Convergence Divergence (MACD) continues to print flat red bars, suggesting a constant selling activity but indicators hinting at oversold conditions may suggest that a correction looms.

AUD/JPY daily chart

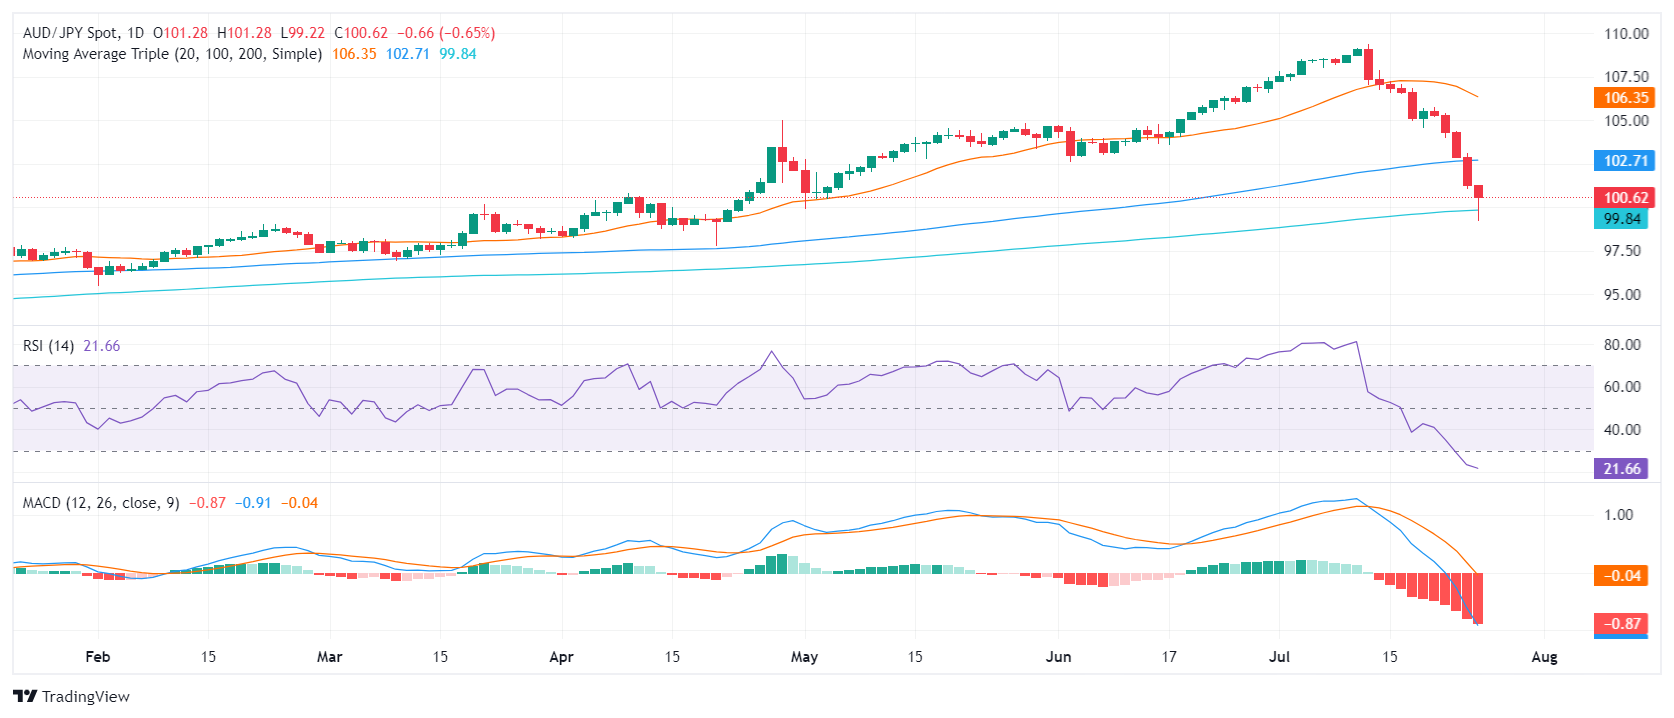
Looking at the wider perspective, the short-term bearish momentum of AUD/JPY seems to persevere. After ceding the 100-day Simple Moving Average (SMA), the pair encountered considerable support at the 200-day SMA, where sellers were quickly shunned, hinting at an imminent correction as the pair entered the oversold territory.

Going forward, the pair needs to keep a foothold at the 200-day SMA at 100.00, a strong support level. Other levels to watch on the downside include the areas around 99.50 and 99.30. For any possibility of recovery, buyers should aim to regain the ground above the immediate resistance at 101.00 and then target the 102.70 area where the 100-day SMA converges to offset potential losses.

Author

Patricio Martín

Patricio is an economist from Argentina passionate about global finance and understanding the daily movements of the markets.

More from Patricio Martín
Share:

Editor's Picks

AUD/USD falls to near 0.7100 after slipping below 50-day EMA

AUD/USD depreciates after registering minor gains in the previous day, trading around 0.7120 during the Asian hours. The technical analysis of the daily chart shows the pair consolidating sideways within a rectangle pattern, as neither bulls nor bears gain control. The AUD/USD pair is holding a slight bearish tone however as it sits beneath both the nine-day and 50-day EMAs.

160.00: USD/JPY back near intervention territory after upbeat US jobs report

US Nonfarm Payrolls beat expectations by a wide margin in May, with 172K jobs added. The US Dollar rebounds after the release, helping USD/JPY recover from its intraday lows. Warnings from Japanese authorities continue to limit upside potential near the 160.00 threshold.

Gold targets $4,300 amid stronger Dollar

Gold faces increasing selling interest and navigates the area of three-month lows near the $4,300 mark per troy ounce on Friday. The precious metal’s decline comes as traders assess the stronger-than-expected NFP, while the bid bias in the Greenback and higher US Treasury yields also collaborate with the retracement.

Cardano hits five-year low even as Hoskinson clarifies "break" isn't an exit

Cardano (ADA) price is down 10% at press time on Friday, extending losses over 30% so far this week amid Charles Hoskinson's clarification that "break" isn't an exit.

Week ahead – Fed countdown begins amid US inflation data and geopolitical risks

Fed Chair Warsh’s first meeting approaches as key US inflation data could reshape expectations. Oil prices remain elevated as US-Iran talks continue; tariffs also return to the spotlight. ECB is expected to hike; will it be a one-off move or is July live?

The US economy defies the rules: 100 days into the Oil shock and the recession signal is still missing

More than three months after the start of the Iran war and the resulting disruption to global energy markets, the US economy continues to display remarkable resilience. The conflict has triggered a sharp rise in Oil prices, reignited inflationary pressures and fueled widespread concerns about a potential economic slowdown.