AUD/JPY Price Analysis: Consolidates losses near one-week low, below 10/21-day SMA
- AUD/JPY sellers catch a breath after two consecutive days of losses.
- Sustained trading below short-term key SMAs keeps bears hopeful.
- Buyers will look for entry beyond the three-week-old horizontal line.

Following its drop to the lowest in more than a week, not to forget downside break of 10-day SMA, AUD/JPY retraces losses to 0.6515 amid the Asian session on Thursday.
Even so, the pair remains below 38.2% Fibonacci retracement level of February-March declines, at 65.45, a break of which could push it to probe 10-day SMA level of 65.80.
If at all the buyers, based on the bullish MACD, manage to break 10-day SMA on a daily closing basis, 21-day SMA, currently at 66.20, could question further upside of the pair, if not then a horizontal line from March 12, near 67.70, will be the key to watch.
On the downside, 64.00 could please bears below the quote’s declines under the latest low near 64.90/85.
Additionally, 23.6% Fibonacci retracement level near 63.30 and March 18 low near 61.70 can please return to the chart given the sellers’ dominance past-64.85.
AUD/JPY daily chart
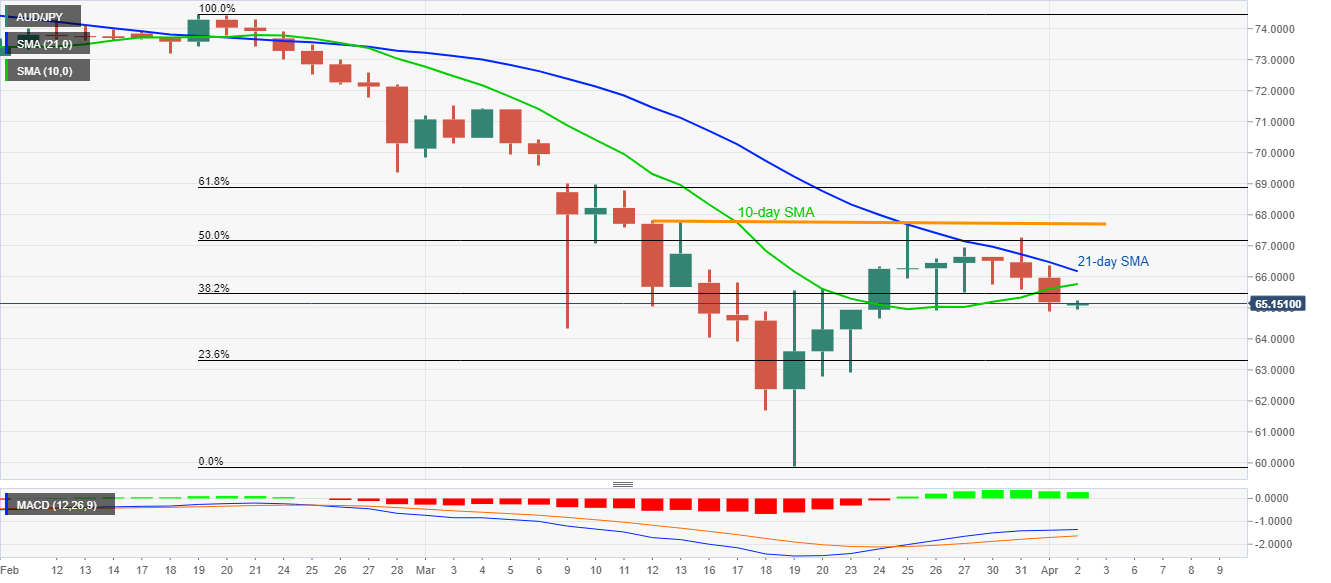
Trend: Bearish
Author

Anil Panchal
FXStreet
Anil Panchal has nearly 15 years of experience in tracking financial markets. With a keen interest in macroeconomics, Anil aptly tracks global news/updates and stays well-informed about the global financial moves and their implications.


