|

AUD/JPY Price Analysis: Bulls step in and steal the 20-day SMA

  • AUD/JPY was seen trading around the 95.30 area ahead of the Asian session, extending its rally.
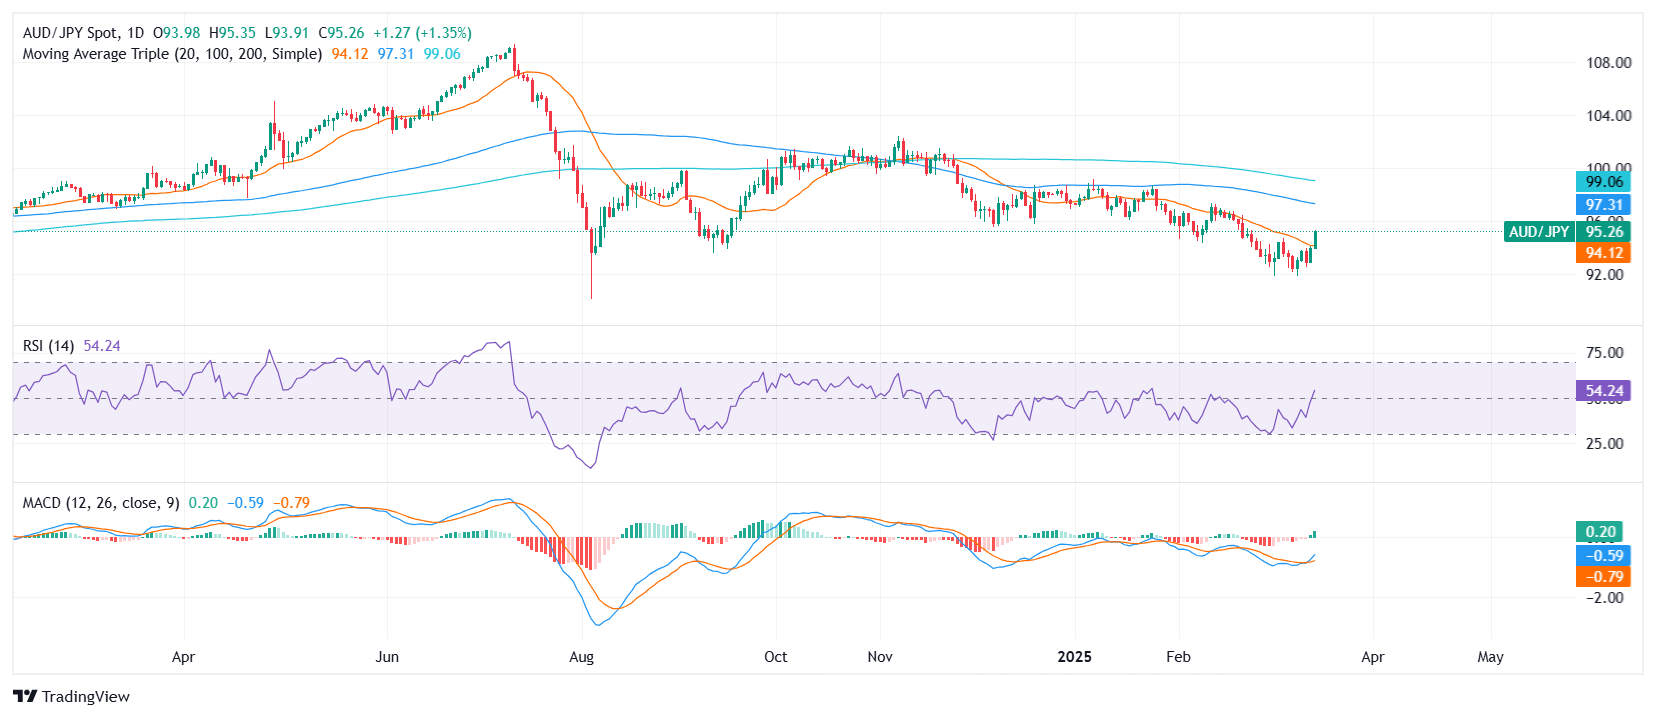
  • The pair climbed above the 20-day SMA, with indicators shifting into positive territory, suggesting sustained bullish momentum.

AUD/JPY surged on Monday ahead of the Asian session, gaining traction and trading near the 95.30 zone after a strong bullish advance. Buyers took control, pushing the pair beyond the 20-day Simple Moving Average (SMA), signaling a shift in momentum that could sustain further gains in the near term.

The Relative Strength Index (RSI) is trending higher in positive territory, reflecting the renewed strength of buyers, while the Moving Average Convergence Divergence (MACD) is printing rising green bars, reinforcing the improving outlook. The bullish crossover in momentum indicators suggests that the pair could maintain its upward trajectory.

Looking ahead, immediate resistance is seen at 95.50, with a breakout above this level paving the way toward 96.00. On the downside, initial support lies near 94.50, followed by a stronger floor around 94.00. As long as the pair holds above the 20-day SMA, the short-term outlook remains constructive for bulls.

AUD/JPY daily chart

Author

Patricio Martín

Patricio is an economist from Argentina passionate about global finance and understanding the daily movements of the markets.

More from Patricio Martín
Share:

Markets move fast. We move first.

Orange Juice Newsletter brings you expert driven insights - not headlines. Every day on your inbox.

By subscribing you agree to our Terms and conditions.

Editor's Picks

EUR/USD: Bulls pray for a dovish Fed

EUR/USD has finally taken a breather after a pretty energetic climb. The pair broke above 1.1680 in the second half of the week, reaching its highest levels in around two months before running into some selling pressure. Even so, it has gained almost two cents from the late-November dip just below 1.1500 the figure.

GBP/USD trims gains, recedes toward 1.3320

GBP/USD is struggling to keep its daily advance, coming under fresh pressure and retreating to the 1.3320 zone following a mild bullish attempt in the Greenback. Even though US consumer sentiment surprised to the upside, the US Dollar isn’t getting much love, as traders are far more interested in what the Fed will say next week.

Gold: Bullish momentum fades despite broad USD weakness

After rising more than 3.5% in the previous week, Gold has entered a consolidation phase and fluctuated at around $4,200. The Federal Reserve’s interest rate decision and revised Summary of Economic Projections, also known as the dot plot, could trigger the next directional move in XAU/USD. 

Week ahead: Rate cut or market shock? The Fed decides

Fed rate cut widely expected; dot plot and overall meeting rhetoric also matter. Risk appetite is supported by Fed rate cut expectations; cryptos show signs of life. RBA, BoC and SNB also meet; chances of surprises are relatively low. Dollar weakness could linger; both the aussie and the yen best positioned to gain further. Gold and oil eye Ukraine-Russia developments; a peace deal remains elusive.

Week ahead – Rate cut or market shock? The Fed decides

Fed rate cut widely expected; dot plot and overall meeting rhetoric also matter. Risk appetite is supported by Fed rate cut expectations; cryptos show signs of life. RBA, BoC and SNB also meet; chances of surprises are relatively low.

Ripple faces persistent bear risks, shrugging off ETF inflows

Ripple is extending its decline for the second consecutive day, trading at $2.06 at the time of writing on Friday. Sentiment surrounding the cross-border remittance token continues to lag despite steady inflows into XRP spot ETFs.