|

AUD/JPY Price Analysis: Bulls hold the fort despite closing a losing week

  • The AUD/JPY stands strong at around 97.45, flaunting a gain of 0.25%.
  • Despite the upwards movements, the cross will still close a 0.20% weekly loss.
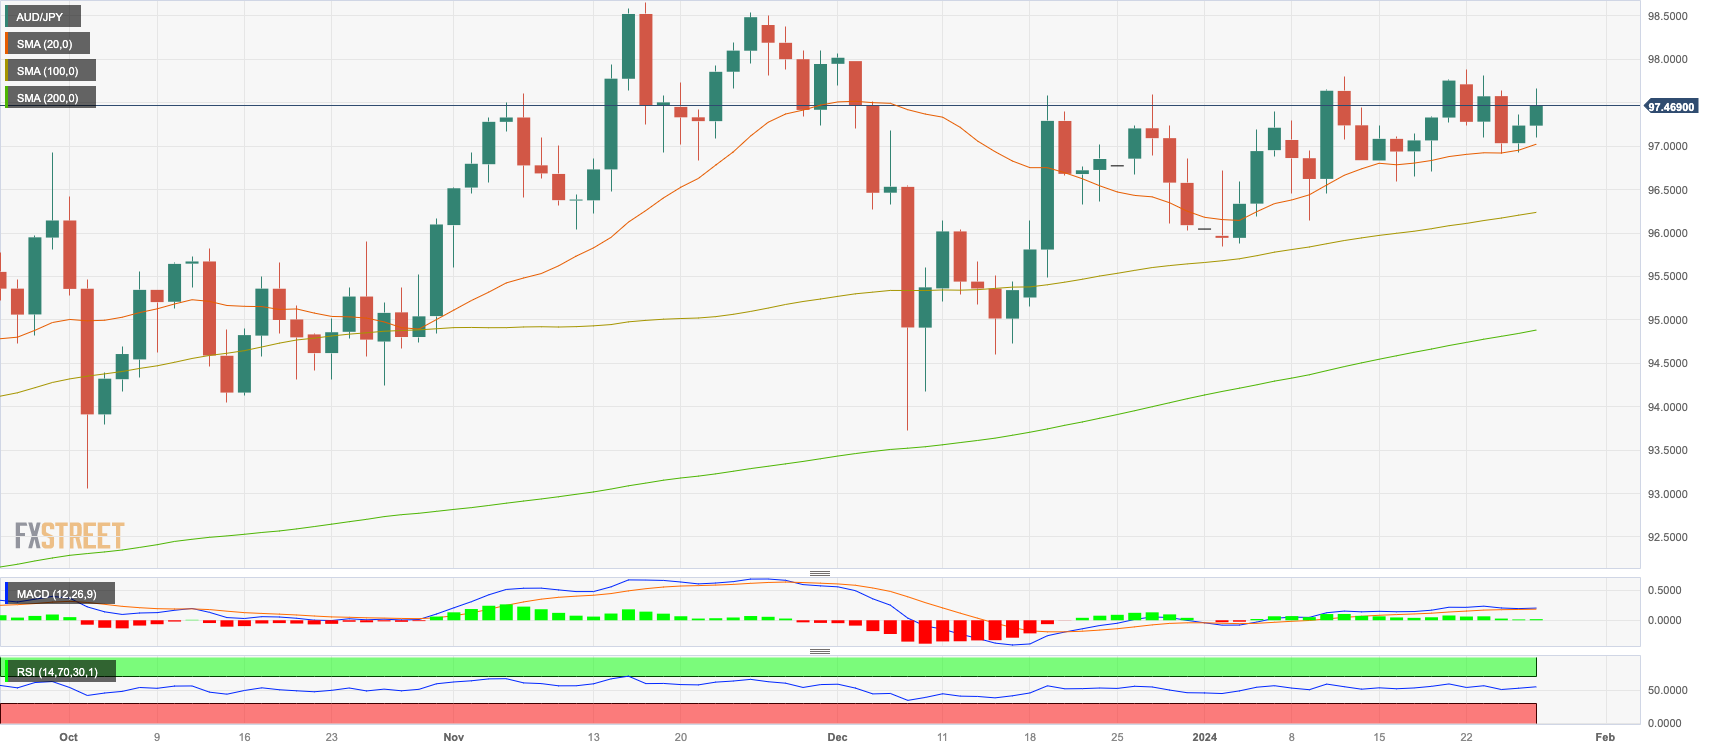
  • An optimistic scenario is reflected in larger time frames with the pair trading above the 20,100,200-day SMAs.

On Friday's session, the AUD/JPY was trading at 97.45, up by 0.25%. The daily chart shows a neutral to bullish sentiment, with bulls keenly holding their ground while the four-hour outlook mirrors the daily one, with a predominant bullish presence.

The indications on the daily chart reflect a sideway move with a slight bullish inclination. A surge is suggested by the Relative Strength Index (RSI) with a positive slope and lies in positive space, indicating that the buying strength still holds the upper hand. Yet, the Moving Average Convergence Divergence (MACD) showing static green bars suggests a lack of momentum for further bullish advancement. However, positioning above the 20, 100, and 200-day Simple Moving Averages (SMAs) solidifies the evidence that bulls dominate in the long-run realm, even with the weekly retracement.

The four-hour chart, it echoes a similar sentiment. The Relative Strength Index (RSI), still in positive territory and on an upward bend hints at the continued presence of bullish momentum. In the meanwhile, the Moving Average Convergence Divergence (MACD) laying flat with red bars could point to a short-term pullback or consolidation period. Nonetheless, the bulls' persistence indicates that the uptrend may continue in the following trading sessions, assuming that buying pressure remains.

AUD/JPY levels to watch

AUD/JPY

Overview
Today last price97.46
Today Daily Change0.22
Today Daily Change %0.23
Today daily open97.24
 
Trends
Daily SMA2096.95
Daily SMA5096.88
Daily SMA10096.21
Daily SMA20094.84
 
Levels
Previous Daily High97.36
Previous Daily Low96.93
Previous Weekly High97.76
Previous Weekly Low96.59
Previous Monthly High98.07
Previous Monthly Low93.73
Daily Fibonacci 38.2%97.2
Daily Fibonacci 61.8%97.1
Daily Pivot Point S196.99
Daily Pivot Point S296.74
Daily Pivot Point S396.56
Daily Pivot Point R197.43
Daily Pivot Point R297.61
Daily Pivot Point R397.86

AUD/JPY daily chart

Author

Patricio Martín

Patricio is an economist from Argentina passionate about global finance and understanding the daily movements of the markets.

More from Patricio Martín
Share:

Markets move fast. We move first.

Orange Juice Newsletter brings you expert driven insights - not headlines. Every day on your inbox.

By subscribing you agree to our Terms and conditions.

Editor's Picks

EUR/USD moves sideways below 1.1800 on Christmas Eve

EUR/USD struggles to find direction and trades in a narrow channel below 1.1800 after posting gains for two consecutive days. Bond and stock markets in the US will open at the usual time and close early on Christmas Eve, allowing the trading action to remain subdued. 

GBP/USD keeps range around 1.3500 amid quiet markets

GBP/USD keeps its range trade intact at around 1.3500 on Wednesday. The Pound Sterling holds the upper hand over the US Dollar amid pre-Christmas light trading as traders move to the sidelines heading into the holiday season. 

Gold retreats from record highs, trades below $4,500

Gold retreats after setting a new record-high above $4,520 earlier in the day and trades in a tight range below $4,500 as trading volumes thin out ahead of the Christmas break. The US Dollar selling bias remains unabated on the back of dovish Fed expectations, which continues to act as a tailwind for the bullion amid persistent geopolitical risks.

Bitcoin slips below $87,000 as ETF outflows intensify, whale participation declines

Bitcoin price continues to trade around $86,770 on Wednesday, after failing to break above the $90,000 resistance. US-listed spot ETFs record an outflow of $188.64 million on Tuesday, marking the fourth consecutive day of withdrawals.

Economic outlook 2026-2027 in advanced countries: Solidity test

After a year marked by global economic resilience and ending on a note of optimism, 2026 looks promising and could be a year of solid economic performance. In our baseline scenario, we expect most of the supportive factors at work in 2025 to continue to play a role in 2026.

Avalanche struggles near $12 as Grayscale files updated form for ETF

Avalanche trades close to $12 by press time on Wednesday, extending the nearly 2% drop from the previous day. Grayscale filed an updated form to convert its Avalanche-focused Trust into an ETF with the US Securities and Exchange Commission.