|

AUD/JPY Price Analysis: Breaks below 104.00, followed by support at 14-day EMA

  • AUD/JPY could test the key level of 104.00, followed by the upper boundary of the ascending triangle.
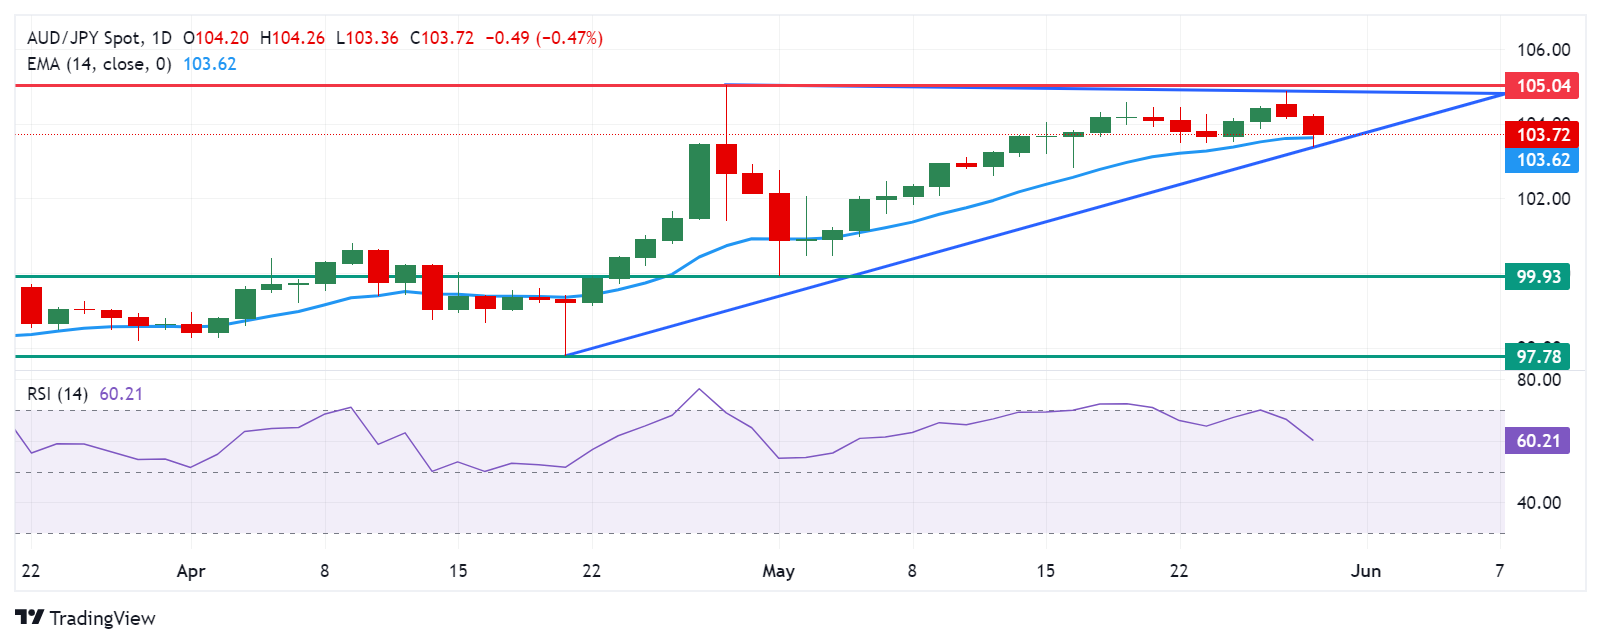
  • The momentum indicator 14-day RSI suggests the confirmation of the bullish bias for the pair.
  • The immediate support appears around the 14-day EMA at 103.63 and the lower threshold of the ascending triangle.

AUD/JPY extends its losses to near 103.80 during European trading hours on Thursday. However, the analysis of the daily chart indicates a bullish bias for the AUD/JPY pair, as it remains within an ascending triangle. Furthermore, the momentum indicator 14-day Relative Strength Index (RSI) is above the 50 level, suggesting confirmation of the bullish outlook.

The AUD/JPY cross could test the immediate resistance at the psychological level of 104.00, followed by the upper boundary of the ascending triangle around 104.80. A breakthrough above this level could reinforce the bullish sentiment, potentially pushing the cross past the psychological level of 105.00, aligning with the highest level of 105.04, which has not been seen since April 2013.

On the downside, the 14-day Exponential Moving Average (EMA) at 103.62 serves as immediate support for the AUD/JPY cross, followed by the lower threshold of the ascending triangle around the key level of 103.50.

A break below the latter could lead the AUD/JPY cross to navigate the region around the psychological level of 100.00 and the throwback support at 99.93. Further decline could exert downward pressure on the cross, potentially driving it toward April's low of 97.78.

AUD/JPY: Daily Chart

AUD/JPY

Overview
Today last price103.76
Today Daily Change-0.45
Today Daily Change %-0.43
Today daily open104.21
 
Trends
Daily SMA20103.28
Daily SMA50101.24
Daily SMA10099.41
Daily SMA20097.65
 
Levels
Previous Daily High104.87
Previous Daily Low104.12
Previous Weekly High104.56
Previous Weekly Low103.48
Previous Monthly High105.04
Previous Monthly Low97.78
Daily Fibonacci 38.2%104.4
Daily Fibonacci 61.8%104.58
Daily Pivot Point S1103.93
Daily Pivot Point S2103.65
Daily Pivot Point S3103.18
Daily Pivot Point R1104.68
Daily Pivot Point R2105.15
Daily Pivot Point R3105.43

Author

Akhtar Faruqui

Akhtar Faruqui is a Forex Analyst based in New Delhi, India. With a keen eye for market trends and a passion for dissecting complex financial dynamics, he is dedicated to delivering accurate and insightful Forex news and analysis.

More from Akhtar Faruqui
Share:

Editor's Picks

AUD/USD falls to near 0.7100 after slipping below 50-day EMA

AUD/USD depreciates after registering minor gains in the previous day, trading around 0.7120 during the Asian hours. The technical analysis of the daily chart shows the pair consolidating sideways within a rectangle pattern, as neither bulls nor bears gain control. The AUD/USD pair is holding a slight bearish tone however as it sits beneath both the nine-day and 50-day EMAs.

160.00: USD/JPY back near intervention territory after upbeat US jobs report

US Nonfarm Payrolls beat expectations by a wide margin in May, with 172K jobs added. The US Dollar rebounds after the release, helping USD/JPY recover from its intraday lows. Warnings from Japanese authorities continue to limit upside potential near the 160.00 threshold.

Gold targets $4,300 amid stronger Dollar

Gold faces increasing selling interest and navigates the area of three-month lows near the $4,300 mark per troy ounce on Friday. The precious metal’s decline comes as traders assess the stronger-than-expected NFP, while the bid bias in the Greenback and higher US Treasury yields also collaborate with the retracement.

Cardano hits five-year low even as Hoskinson clarifies "break" isn't an exit

Cardano (ADA) price is down 10% at press time on Friday, extending losses over 30% so far this week amid Charles Hoskinson's clarification that "break" isn't an exit.

Week ahead – Fed countdown begins amid US inflation data and geopolitical risks

Fed Chair Warsh’s first meeting approaches as key US inflation data could reshape expectations. Oil prices remain elevated as US-Iran talks continue; tariffs also return to the spotlight. ECB is expected to hike; will it be a one-off move or is July live?

The US economy defies the rules: 100 days into the Oil shock and the recession signal is still missing

More than three months after the start of the Iran war and the resulting disruption to global energy markets, the US economy continues to display remarkable resilience. The conflict has triggered a sharp rise in Oil prices, reignited inflationary pressures and fueled widespread concerns about a potential economic slowdown.