|

AUD/JPY Price Analysis: Bearish pressure intensifies, sellers eye the 20-day SMA

  • The daily chart reveals an overall positive trend but indicators took a big hit on Friday.
  • The hourly RSI hints at a possible short-term upswing following a plunge into the oversold territory.
  • The pair might side-ways trade to consolidate Friday’s movements..

The AUD/JPY pair is currently trading at 98.60, showing a substantial decrease of nearly 1%. Despite this decline, the broader trend continues to show positivity, with bulls maintaining their control. In addition, as the downward movements might be over-extended, the pair may enter a consolidation phase.

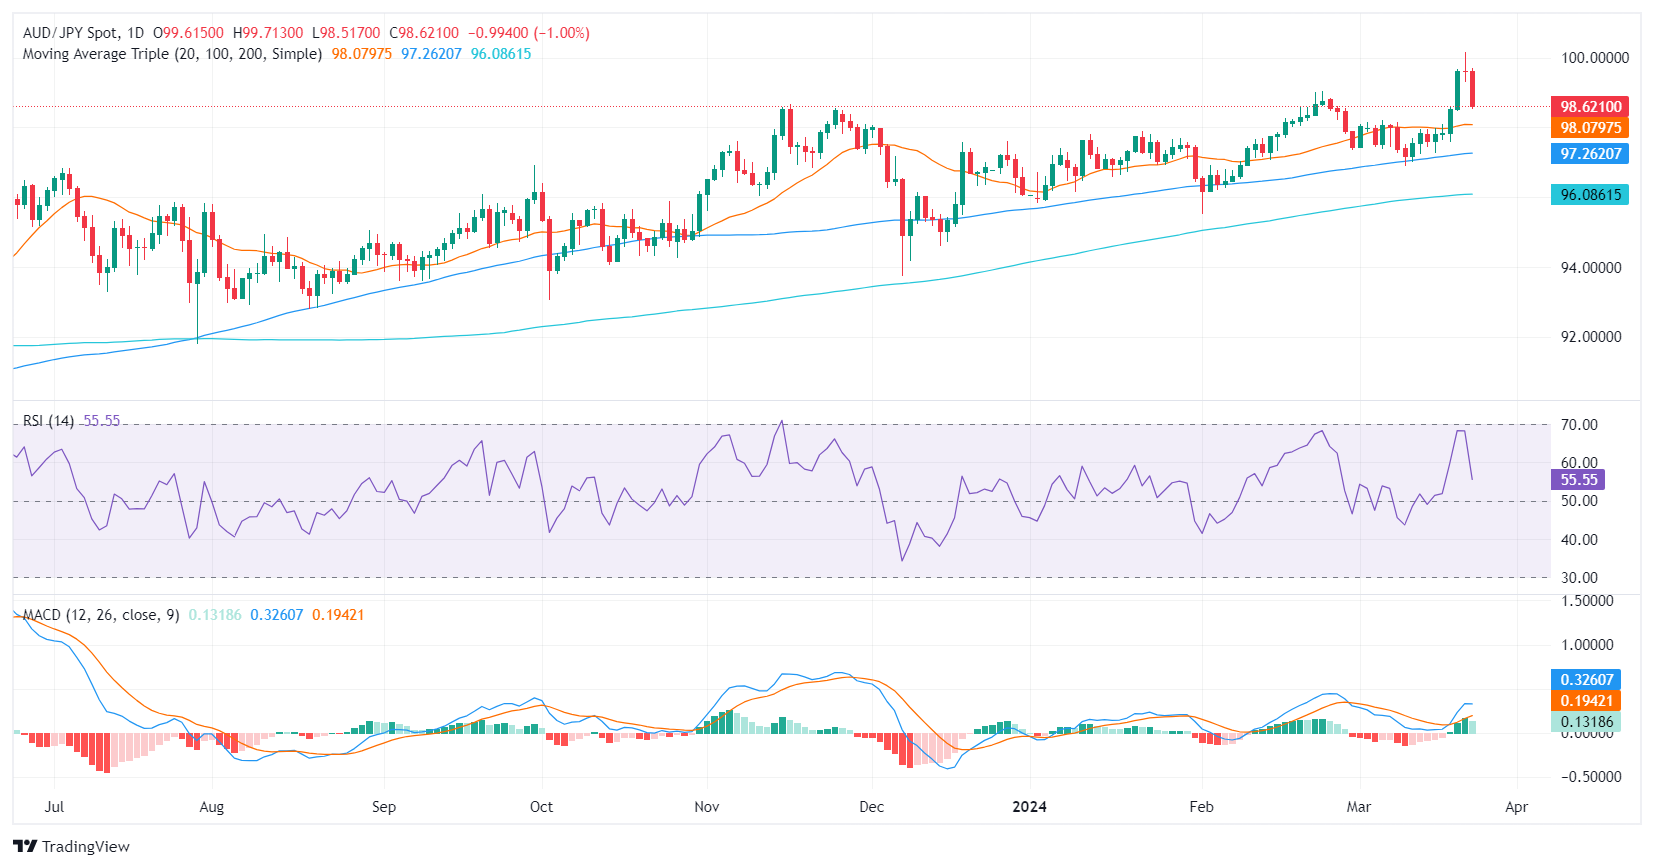
On the daily chart, the technical outlook for the AUD/JPY pair suggests a positive trend. The latest Relative Strength Index (RSI) reading resides in the positive territory, aligning with the recent upward momentum. Having peaked near overbought conditions earlier in the week, the RSI has now pulled back to a moderate level, pointing towards potential consolidation. Concurrently, the Moving Average Convergence Divergence (MACD) paints a contrasting picture, showing decreasing green bars that signify a slowdown in positive market momentum.

AUD/JPY daily chart

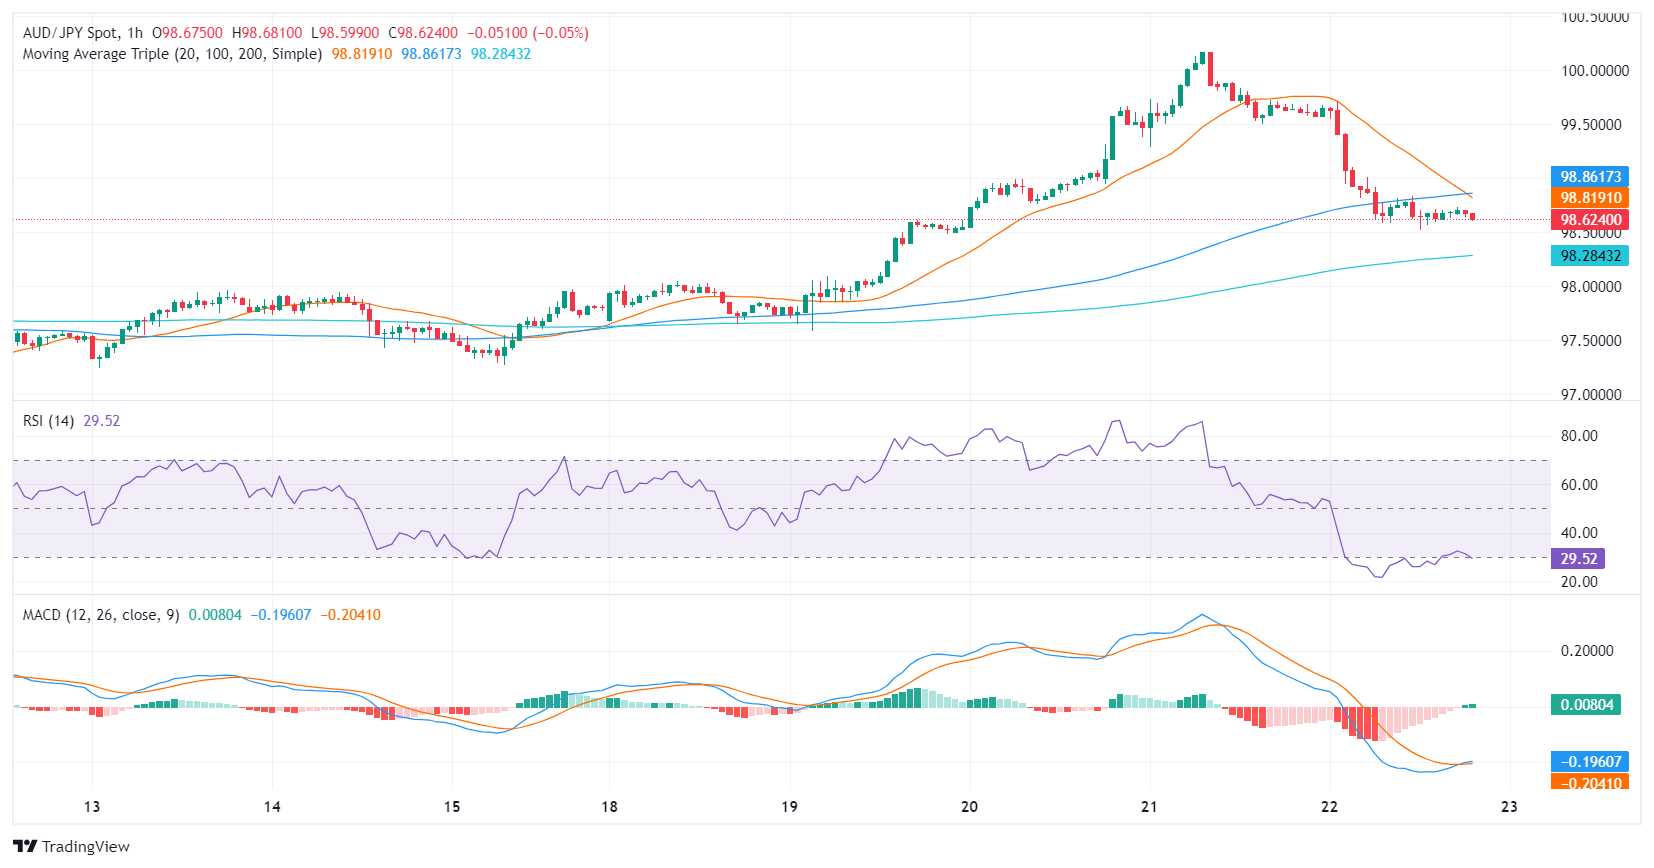
Switching to the hourly chart, the last session's RSI plunged deep into the oversold territory, which could hint at a potential short-term correction upwards. Despite the sharp drop in the RSI, the MACD histogram displays flat green bars, implying stagnating bullish momentum on hourly timeframes.

AUD/JPY hourly chart

The next target for the sellers is the 20-day Simple Moving Average (SMA) at 98.10. Below that the 100 and 200-day SMAs will act as strong supports in case the downside pressure persists but if the bulls defend this level, the overall trend will remain positive.

AUD/JPY

Overview
Today last price98.64
Today Daily Change-0.98
Today Daily Change %-0.98
Today daily open99.62
 
Trends
Daily SMA2098.09
Daily SMA5097.63
Daily SMA10097.25
Daily SMA20096.08
 
Levels
Previous Daily High100.17
Previous Daily Low99.29
Previous Weekly High97.97
Previous Weekly Low96.9
Previous Monthly High99.06
Previous Monthly Low95.5
Daily Fibonacci 38.2%99.63
Daily Fibonacci 61.8%99.83
Daily Pivot Point S199.21
Daily Pivot Point S298.81
Daily Pivot Point S398.33
Daily Pivot Point R1100.09
Daily Pivot Point R2100.57
Daily Pivot Point R3100.97

Author

Patricio Martín

Patricio is an economist from Argentina passionate about global finance and understanding the daily movements of the markets.

More from Patricio Martín
Share:

Markets move fast. We move first.

Orange Juice Newsletter brings you expert driven insights - not headlines. Every day on your inbox.

By subscribing you agree to our Terms and conditions.

Editor's Picks

EUR/USD: Bulls pray for a dovish Fed

EUR/USD has finally taken a breather after a pretty energetic climb. The pair broke above 1.1680 in the second half of the week, reaching its highest levels in around two months before running into some selling pressure. Even so, it has gained almost two cents from the late-November dip just below 1.1500 the figure.

GBP/USD trims gains, recedes toward 1.3320

GBP/USD is struggling to keep its daily advance, coming under fresh pressure and retreating to the 1.3320 zone following a mild bullish attempt in the Greenback. Even though US consumer sentiment surprised to the upside, the US Dollar isn’t getting much love, as traders are far more interested in what the Fed will say next week.

Gold: Bullish momentum fades despite broad USD weakness

After rising more than 3.5% in the previous week, Gold has entered a consolidation phase and fluctuated at around $4,200. The Federal Reserve’s interest rate decision and revised Summary of Economic Projections, also known as the dot plot, could trigger the next directional move in XAU/USD. 

Week ahead: Rate cut or market shock? The Fed decides

Fed rate cut widely expected; dot plot and overall meeting rhetoric also matter. Risk appetite is supported by Fed rate cut expectations; cryptos show signs of life. RBA, BoC and SNB also meet; chances of surprises are relatively low. Dollar weakness could linger; both the aussie and the yen best positioned to gain further. Gold and oil eye Ukraine-Russia developments; a peace deal remains elusive.

The Silver disconnection is real

Silver just hit a new all-time high. Neither did gold, nor mining stocks. They all reversed on an intraday basis, but silver’s move to new highs makes it still bullish overall, while the almost complete reversals in gold and miners make the latter technically bearish.

Ripple faces persistent bear risks, shrugging off ETF inflows

Ripple is extending its decline for the second consecutive day, trading at $2.06 at the time of writing on Friday. Sentiment surrounding the cross-border remittance token continues to lag despite steady inflows into XRP spot ETFs.