|

AUD/JPY Price Analysis: Bearish H&S in the making in a 61.8% golden retracement?

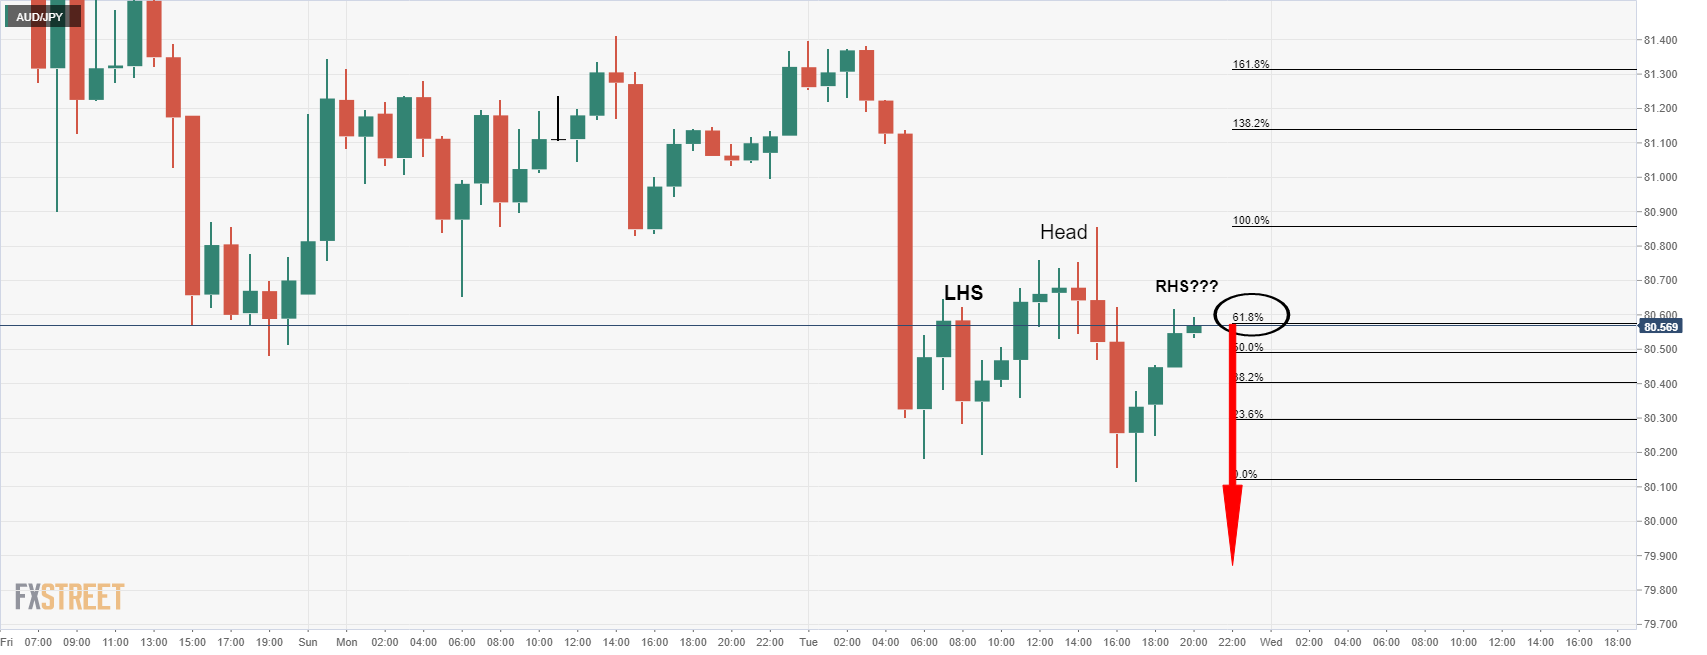
  • AUD/JPY is forming a head and shoulders pattern on the hourly chart.
  • AUD/JPY has reached a 61.8% Fibonacci retracement level as well. 

From an hourly perspective, the forex market's risk barometer has been on the offer mid-week considering the risks related to the coronavirus variant, Omicron, as well as inflation pressures that are upsetting global equities

The following illustrates the recent price action and the chart formation taking shape that could be regarded as a bearish prospect for the forthcoming sesisons. 

AUD/JPY H1 chart

AUD/JPY daily chart

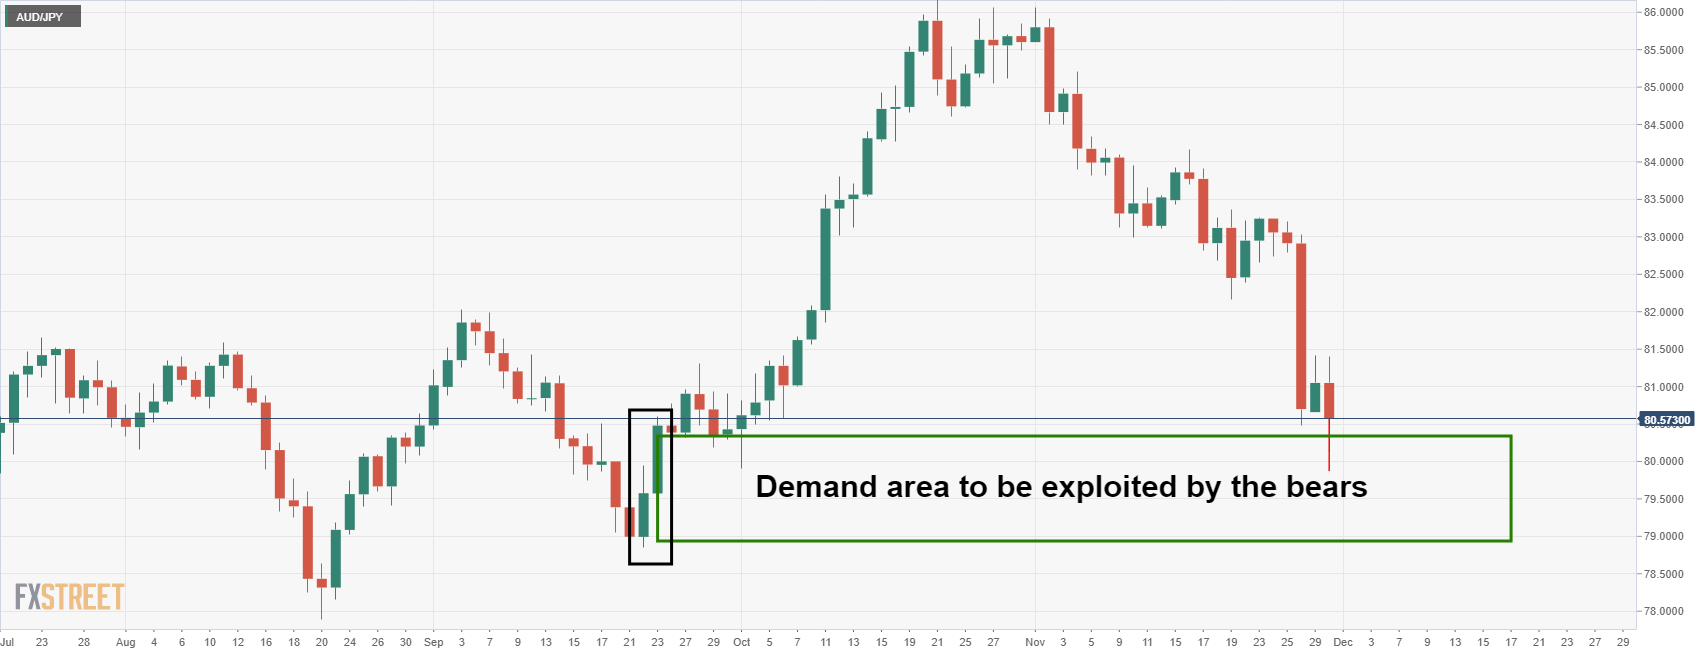
The bears are looking to tap into the liquidity to sell into and take profits between 78.50 and 80 the figure for the coming days.

AUD/HPY 15-min chart

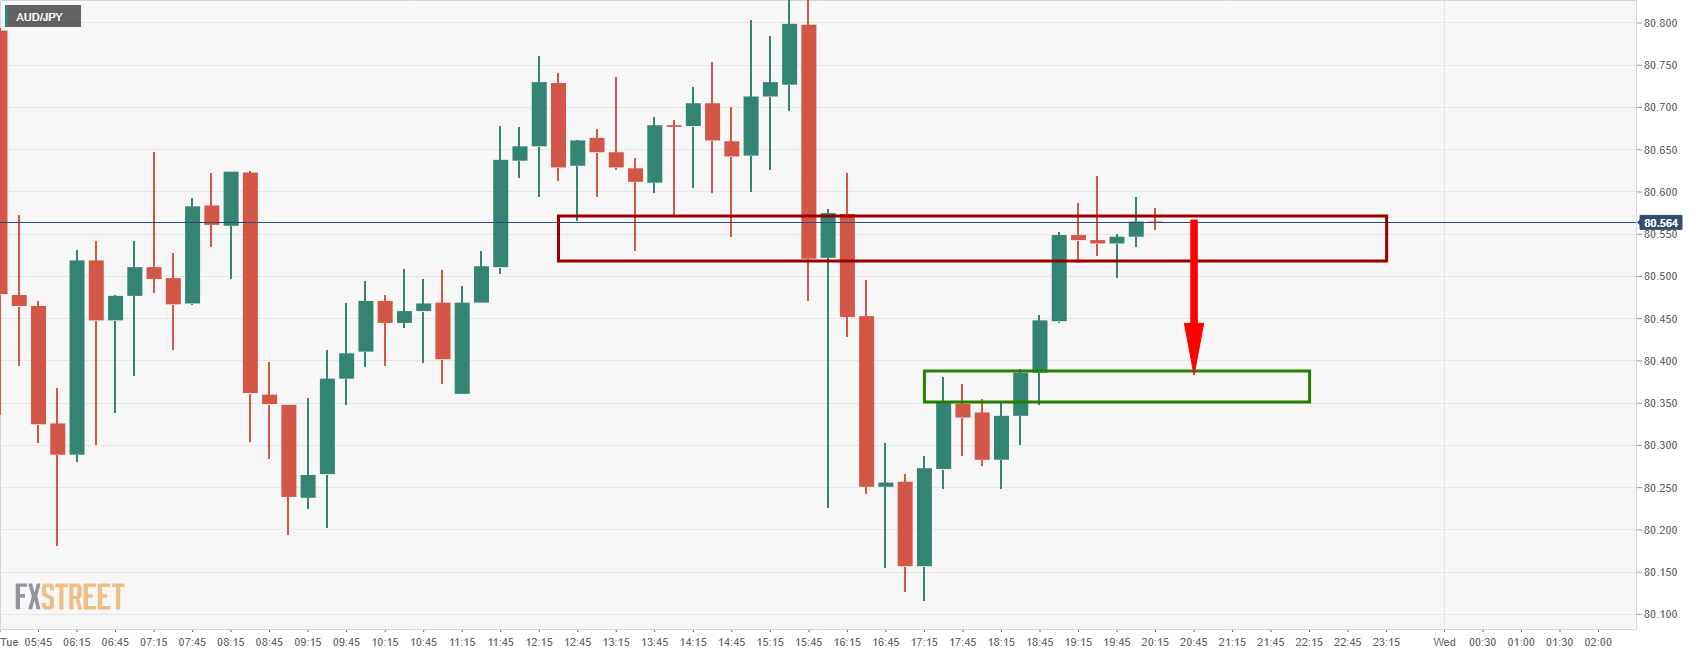
From a short term perspective, the W-formation's neckline around 80.40 is compelling should the cross be rejected in the current support territory. 

Author

Ross J Burland

Ross J Burland, born in England, UK, is a sportsman at heart. He played Rugby and Judo for his county, Kent and the South East of England Rugby team.

More from Ross J Burland
Share:

Editor's Picks

EUR/USD faces some resistance near 100-SMA on H4, around 1.1830 zone

The EUR/USD pair gains some follow-through positive traction for the second consecutive day and climbs to the 1.1830 region during the Asian session on Thursday. The US Dollar remains on the back foot amid concerns about the economic fallout from US President Donald Trump's erratic trade policies and acts as a tailwind for spot prices.

GBP/USD extends recovery to near 20-day EMA as US Dollar weakens

The Pound Sterling holds onto weekly gains around 1.3565 against the US Dollar during the Asian trading session on Thursday. The GBP/USD pair trades firmly as the US Dollar remains under pressure due to uncertainty surrounding the United States trade policy outlook.

Gold looks to build on strength beyond $5,200, eyes monthly peak amid safe-haven flows

Gold touches a fresh daily high heading into the European session on Thursday, with bulls looking to build on the momentum beyond the $5,200 mark. This marks the second straight day of a positive move and is supported by sustained safe-haven flows, bolstered by uncertainties surrounding US President Donald Trump's trade policies and US-Iran nuclear talks.

Stellar: Relief bounce fades as bearish undertone persists

Stellar is trading around $0.16 at the time of writing on Thursday after rebounding more than 8% in the previous day. Derivatives data paints a negative picture as XLM’s short bets hit a monthly high while Open Interest continues to decline.

Nvidia delivers another monster earnings report, and forecasts big things to come

It was another monster earnings report from Nvidia for fiscal Q4. Revenues were $68.1bn, smashing estimates of $65bn. Gross profit margin was a healthy 75%, up from 73.5% in the prior quarter, and the outlook for this quarter was monstrous.

Solana strikes key resistance with double-digit gains

Solana trades at $88 at press time on Thursday, after an 11% upswing the previous day within a broader consolidation range of roughly three weeks. Institutional demand for Solana heightens as US spot SOL Exchange Traded Funds record $30 million of inflow on Wednesday.