|

AT&T (T) ended a cycle possible corrective bounce ahead

AT&T Inc. (T) is an American multinational telecommunications holding company headquartered in Dallas, Texas. It is the world’s largest telecommunications company by revenue and the third-largest provider of mobile telephone services in the U.S.

T monthly chart September 2023

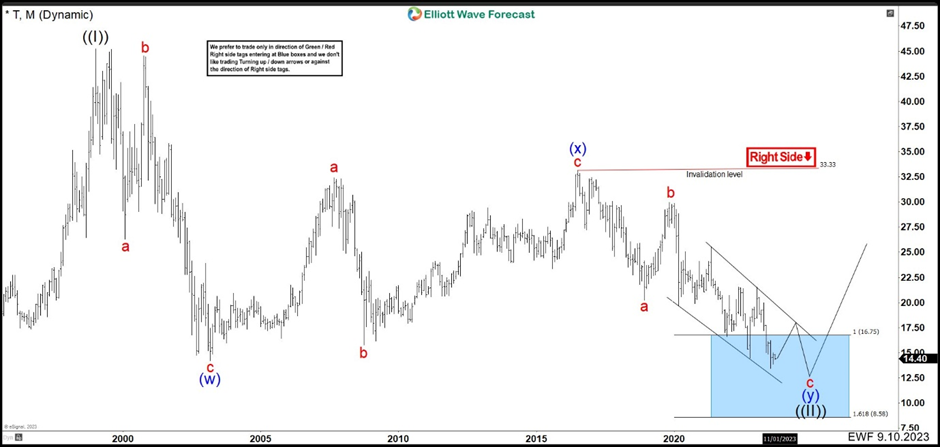
In the monthly chart above, we can see that AT&T shares finished an all-time high with a price of $45.23. Since the beginning of 1999, the value has held a downtrend and we are looking to end this correction. Using the Elliott Wave Principle, a double correction structure (w), (x) and (y) can be clearly seen. From the peak, we have 3 waves in a flat structure that ends wave (w) at $14.23. Then we have another flat structure that built a wave (x) ending in the value of $33.33.

The last leg of the double correction is the wave (y). We have already completed wave a and b, and we are developing wave c as an ending diagonal structure. The market has already reached the blue box in the $8.58 – $16.75 area. Last update in April 23, we suggested that with the market conditions and the incomplete structure, the price should drop below $14.23 wave (w) low. Currently, the price action has broken the low confirming the double correction structure of wave ((II)).

T weekly chart September 2023

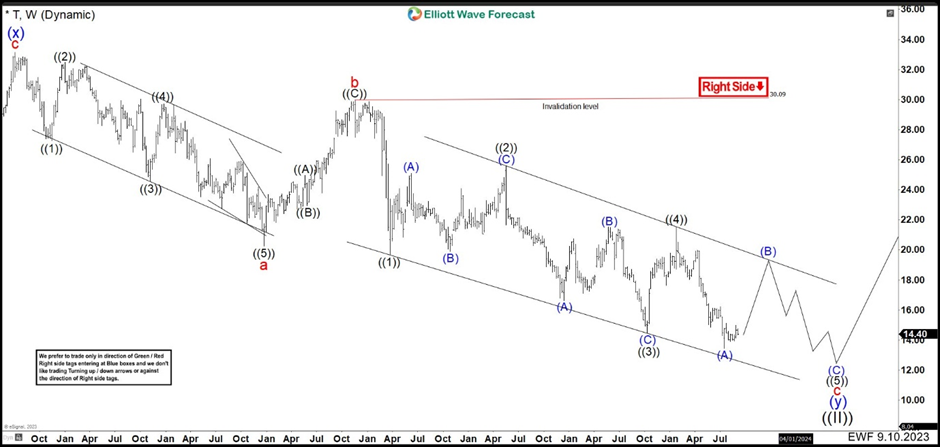
On the weekly chart, we can see in more detail the structure of the wave (y). Wave a in red made a leading diagonal that ended at $20.21. Then it bounced in 3 waves ending wave b at $29.96 to continue sharply lower. Wave c has taken the form of an ending diagonal and it needs 3 more waves to the downside.

Author

Elliott Wave Forecast Team

Elliott Wave Forecast Team

ElliottWave-Forecast.com

More from Elliott Wave Forecast Team
Share:

Editor's Picks

EUR/USD plummets to 1.1840 on US NFP

EUR/USD’s selling momentum now picks up pace and rapidly hits the 1.1840 region on Wednesday. Indeed, the pair’s decline comes amid rising buying pressure on the US Dollar in the wake of firmer-than-expected results from US NFP in January.

GBP/USD approaches 1.3600 on USD-buying

GBP/USD adds to Tuesday’s pullback and trades closer to the 1.3600 support on Wednesday. That said, Cable’s extra downside traction comes against the backdrop of renewed strength in the Greenback as investors assess the latest US NFP data.

Gold trims gains post-NFP, targets $5,000

Gold rapidly reverses initial gains and retreats to the vicinity of the $5,000 region per troy ounce amid further gains in the Greenback and rising US Treasury yields, all following the latest US NFP readings.

US Nonfarm Payrolls expected to show modest job gains in January

The United States Bureau of Labor Statistics will release the delayed Nonfarm Payrolls data for January on Wednesday at 13:30 GMT. Investors expect NFP to rise by 70K following the 50K increase recorded in December.

S&P 500 at 7,000 is a valuation test, not a liquidity problem

The rebound from last week’s drawdown never quite shook the sense that it was being supported by borrowed conviction. The S&P 500 once again tested near the 7,000 level (6,986 as the high watermark) and failed, despite a macro backdrop that would normally be interpreted as supportive of risk.

Bitcoin price slips below $67,000 ahead of US Nonfarm Payrolls data

Bitcoin price extends losses, and trades below the lower consolidating boundary at $67,300 at the time of writing. A firm close below this level could trigger a deeper correction for BTC. Despite the weakness in price action, institutional demand shows signs of support, recording mild inflows in ETFs so far this week.