AT&T pushes higher on strong earnings, here are the key resistance levels

AT&T (T) delivered good earnings, and the stock has responded well, pushing more than 5% higher from its pre-earnings levels. Going into the report, the stock had already been under meaningful pressure, trading more than 22% below its previous highs from September. Because of that prior weakness, the post-earnings reaction stands out, and I’ve been closely watching how price behaves as momentum builds.
Before diving deeper into the chart, it’s worth briefly touching on AT&T itself. AT&T is a long-standing telecom company that remains widely followed in the market, and because of that, its earnings reactions tend to attract significant attention. When a stock like this moves decisively after earnings—especially following a prolonged period of downside—it often creates clear technical levels that traders focus on very closely.
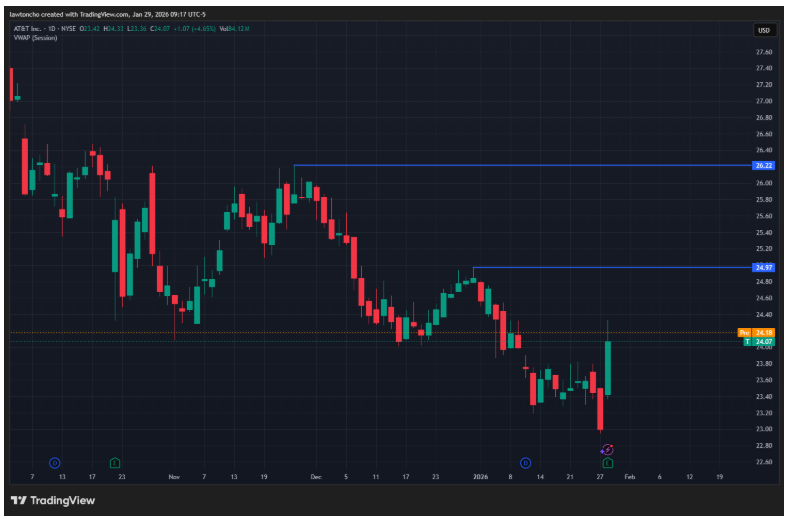
From a technical analysis standpoint, when a stock moves sharply after earnings, my focus immediately shifts to where price may begin to encounter resistance. If this upside momentum continues, the first area I’m watching is the prior pivot highs combined with a gap-fill zone around the $25 level. This area stands out clearly on the chart and represents the first logical spot where buyers may hesitate and sellers may start to step in.
Beyond that, the next level of resistance I see comes in around the $26 mark, which aligns with another pivot high. If price is able to push through the first resistance zone, this secondary level becomes increasingly important from a technicals perspective, as it represents a further test of the stock’s post-earnings strength.
Remember, when trading stocks around earnings-driven moves like this, I stay disciplined with risk management. Earnings volatility can cut both ways, and while momentum can be powerful, it’s critical to respect key technical levels and manage exposure accordingly.
Author

Lawton Ho
Verified Investing
A marketing expert sharing his journey to mastering the charts.


