Asian Paint Indian stocks Elliott Wave technical analysis [Video]
![Asian Paint Indian stocks Elliott Wave technical analysis [Video]](https://editorial.fxsstatic.com/images/i/General-Stocks_1_XtraLarge.png)
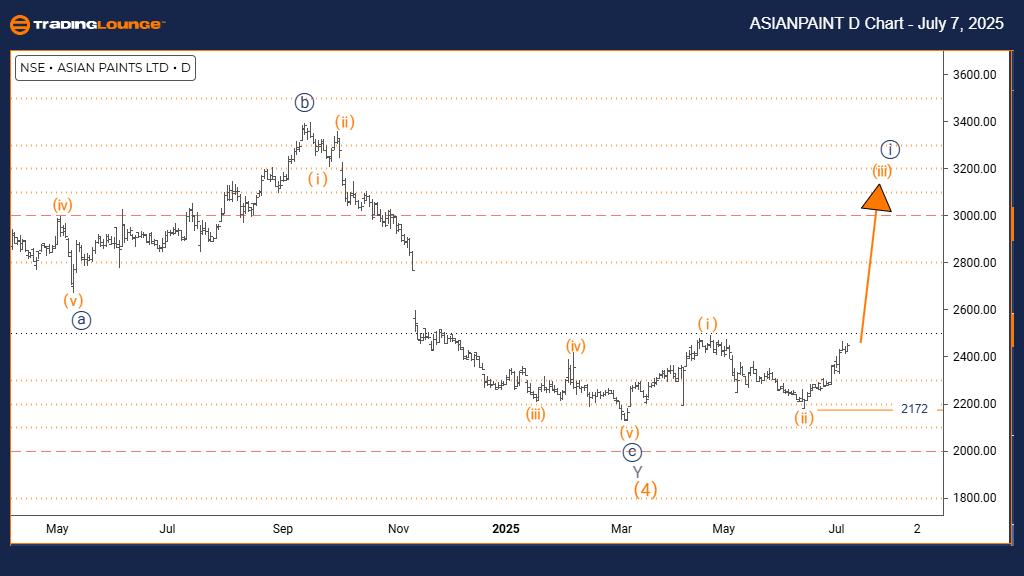
ASIAN PAINT Elliott Wave technical analysis – Day chart
Function: Bullish Trend.
Mode: Impulsive.
Structure: Orange Wave 3.
Position: Navy Blue Wave 1.
Direction next higher degrees: Orange Wave 3 (Initiated).
Details: Orange Wave 2 appears completed; Orange Wave 3 is now underway.
Wave cancel invalid level: 2172.
The ASIAN PAINT daily chart from the Elliott Wave analysis reflects a bullish trend. The price action is currently in an impulsive phase, signaling robust upward momentum. The prevailing wave structure, designated as Orange Wave 3, is part of a broader wave formation identified as Navy Blue Wave 1. This positioning implies that ASIAN PAINT is in a strong advancing stage within a larger bullish trend.
The analysis indicates that Orange Wave 2 has likely ended its corrective move, paving the way for the development of Orange Wave 3. This particular wave phase often signifies the most vigorous segment in an Elliott Wave cycle, usually producing substantial price increases. The next degree to observe is the progress of Orange Wave 3 within the overall Navy Blue Wave 1 structure.
A critical observation level is the invalidation threshold at 2172. If the price drops below this mark, it would invalidate the current wave analysis, necessitating a reevaluation of the bullish outlook. However, unless this point is breached, the existing wave pattern suggests a continued upward movement.
The current technical configuration points to ASIAN PAINT being positioned for potentially extended gains, with Orange Wave 3 in motion following the completion of Orange Wave 2. The impulsive nature of this phase supports strong buying interest and hints at significant upside potential in upcoming sessions.
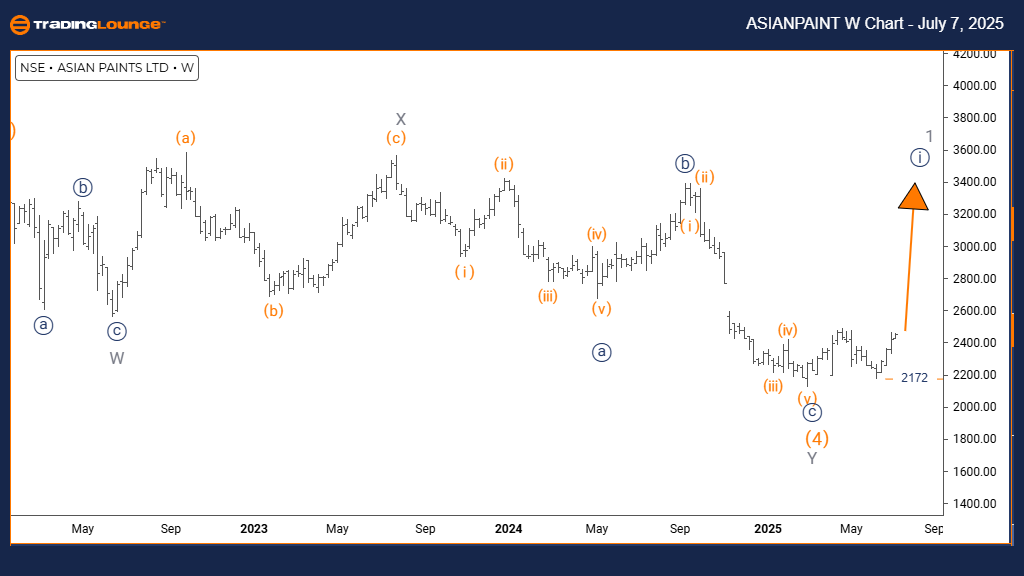
ASIAN PAINT Elliott Wave technical analysis – Weekly chart
Function: Bullish Trend.
Mode: Impulsive.
Structure: Navy Blue Wave 1.
Position: Gray Wave 1.
Direction next lower degrees: Navy Blue Wave 2.
Details: Orange Wave 4 appears completed; Navy Blue Wave 1 of 1 is underway.
Wave cancel invalid level: 2172.
The ASIAN PAINT weekly Elliott Wave analysis affirms a bullish trend. The price action is currently in an impulsive mode, showcasing significant upward momentum. The identified wave structure is Navy Blue Wave 1, which is part of a larger wave sequence labeled as Gray Wave 1. This positioning suggests the stock may be in the initial phase of a strong uptrend within a broader bullish structure.
According to the analysis, Orange Wave 4 has likely completed its correction, allowing the beginning of Navy Blue Wave 1 within Gray Wave 1. This wave usually marks the start of a new bullish cycle and often exhibits strong directional movement. The next expected development is Navy Blue Wave 2, which would emerge after Navy Blue Wave 1 completes.
A key level to observe is the wave cancellation point set at 2172. If prices fall below this level, the current Elliott Wave count would be considered invalid, prompting a reassessment of the structure. Until that threshold is crossed, the current wave formation supports a continuation of the upward trajectory.
The existing technical setup implies that ASIAN PAINT is poised for possible long-term gains. The active Navy Blue Wave 1 suggests ongoing institutional buying interest and enhances the potential for sustained upward price action over the coming weeks, all unfolding within the larger Gray Wave 1 framework.
Asian Paint Indian stocks Elliott Wave technical analysis [Video]
Author

Peter Mathers
TradingLounge
Peter Mathers started actively trading in 1982. He began his career at Hoei and Shoin, a Japanese futures trading company.


