As Vale's stock chart finally shows progress, should we expect a breakout?
- Vale stock has broken above significant topline resistance on daily chart over past week.
- Iron ore prices are holding steady above $100 as China regains economic clout.
- Vale stock is nearing a five-year descending trendline with a breakout possible.
- Bringing Capanema mine online will give Vale an additional 15 million tonnes of iron ore production.

Brazil's Vale (VALE), often hailed as the world's largest iron ore and nickel mining company, might be beginning to turn the page on a five-year downtrend in its share price. After trending lower due to falling iron ore prices, political uncertainty, and a drawn-out legal battle following lawsuits stemming from several catastrophic tailing dam ruptures, bulls are beginning to take the upside narrative seriously.
Vale was able to come to financial terms with the Brazilian government over the dam ruptures last year and has recently made a large offer to settle litigation in the UK involving the same issue.
And earlier this month, Vale announced that it would reopen the Capanema iron ore mine that it had mothballed for 22 years. That mine redevelopment project will cost over $12 billion but will raise Vale's output by about 15 million tonnes per year. This should allow Vale to achieve its goal of 340 million to 360 million annual iron ore production.
Vale stock forecast and technical chart
The Vale stock price is hovering just below the upper trendline of a five-year, descending resistance band, and recent market dynamics point to a coming breakout. The Vale stock price closed at $10.83 on Monday and has risen in Tuesday's premarket, which makes it the highest share price in about nine months.
A break above the five-year top trend line, circa $11.05, could give bulls the energy to push VALE up to the year-ago resistance mark at $12 or the heavy volume patch that ranges from there up to $12.50.
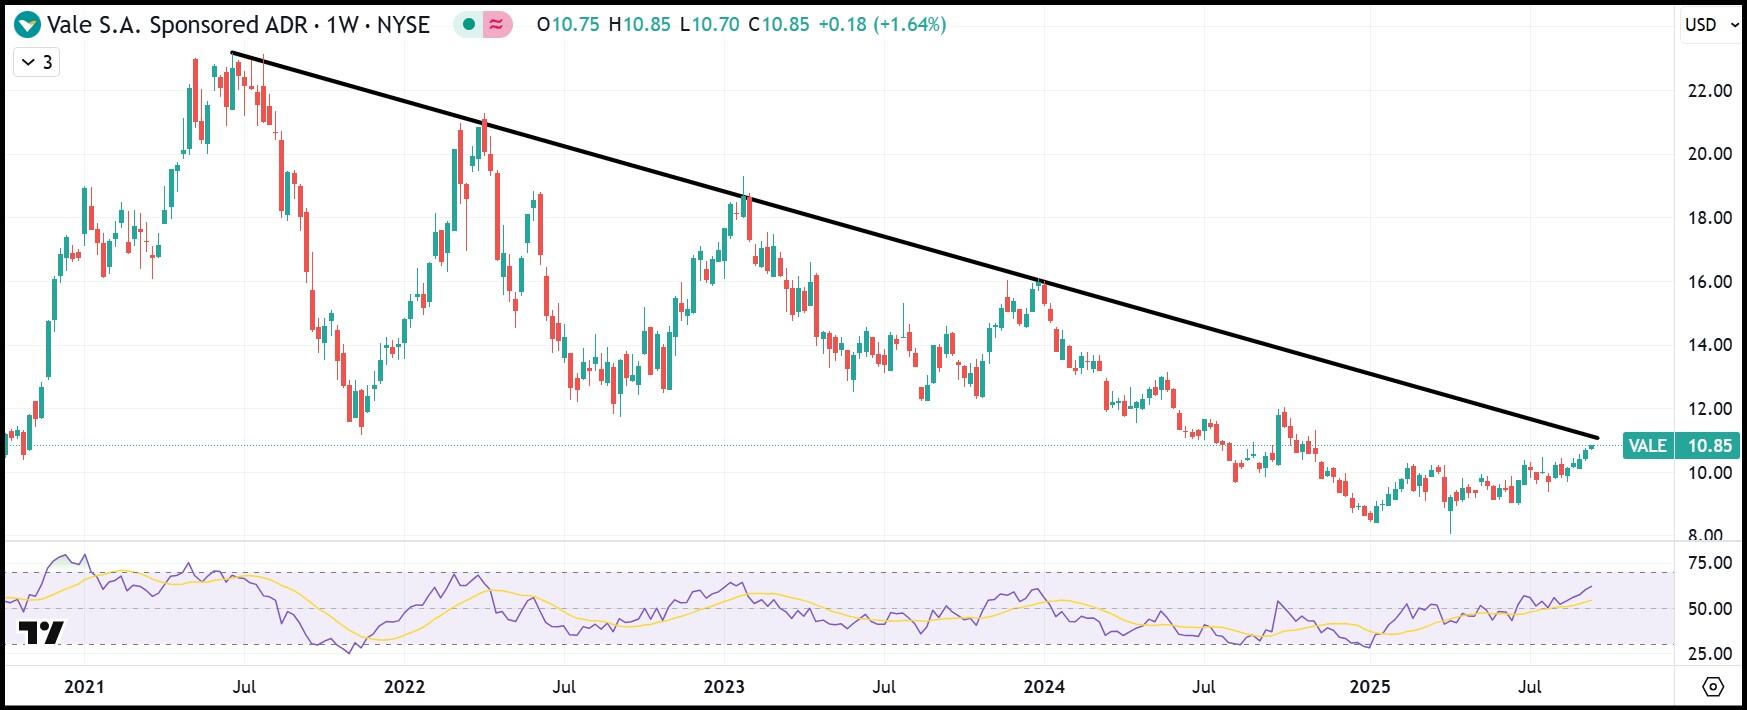
VALE weekly stock chart over past five years
Much of this sudden optimism has to do with China regaining some economic steam after spending the first half of the decade in purgatory. A general downturn, coupled with a real estate crash, has led China to reduce its demand for iron ore since the pandemic period.
Iron ore prices spiked above $220 briefly in mid-2021 before crashing by more than 50% in the subsequent several years. But the chart below shows that iron ore prices have based in the $90s-$100 per metric tonne over the past year and are now perched at $105/metric tonne.
That price is actually quite positive, with Goldman Sachs estimating a base global price in the low $90s for both 2026 and 2027. With the Chinese stock market finally entering an uptrend in 2025 after a long period of backtracking, renewed demand from China is at the forefront of investor thinking.
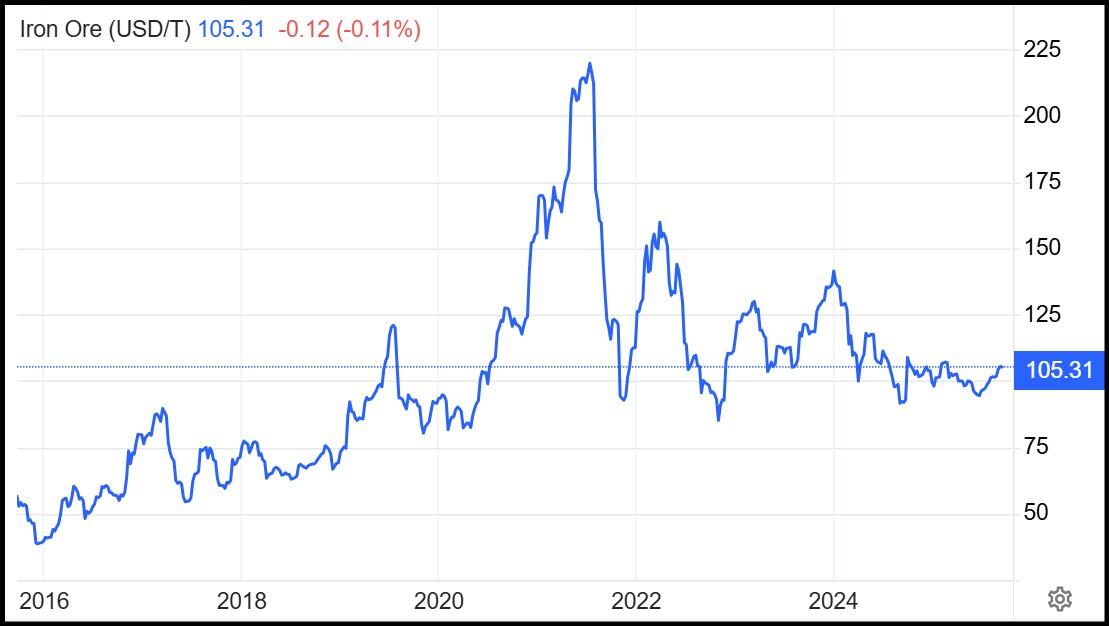
Iron Ore Prices ($/MT) / tradingeconomics.com
The daily chart for Vale also demonstrates promise. After ricocheting within an upward-trending price channel for most of 2025, Vale broke above a resistance trendline last week that had pushed prices lower on five previous occasions this year.
The Relative Strength Index (RSI) above 70 shows the real momentum behind this rally, and the Simple Moving Averages (SMA) have aligned in a proper bullish pattern for the first time in roughly a year and a half. A traditional uptrend sees the 50-day SMA lead the 100-day SMA, which in turn leads the 200-day, as shown below.
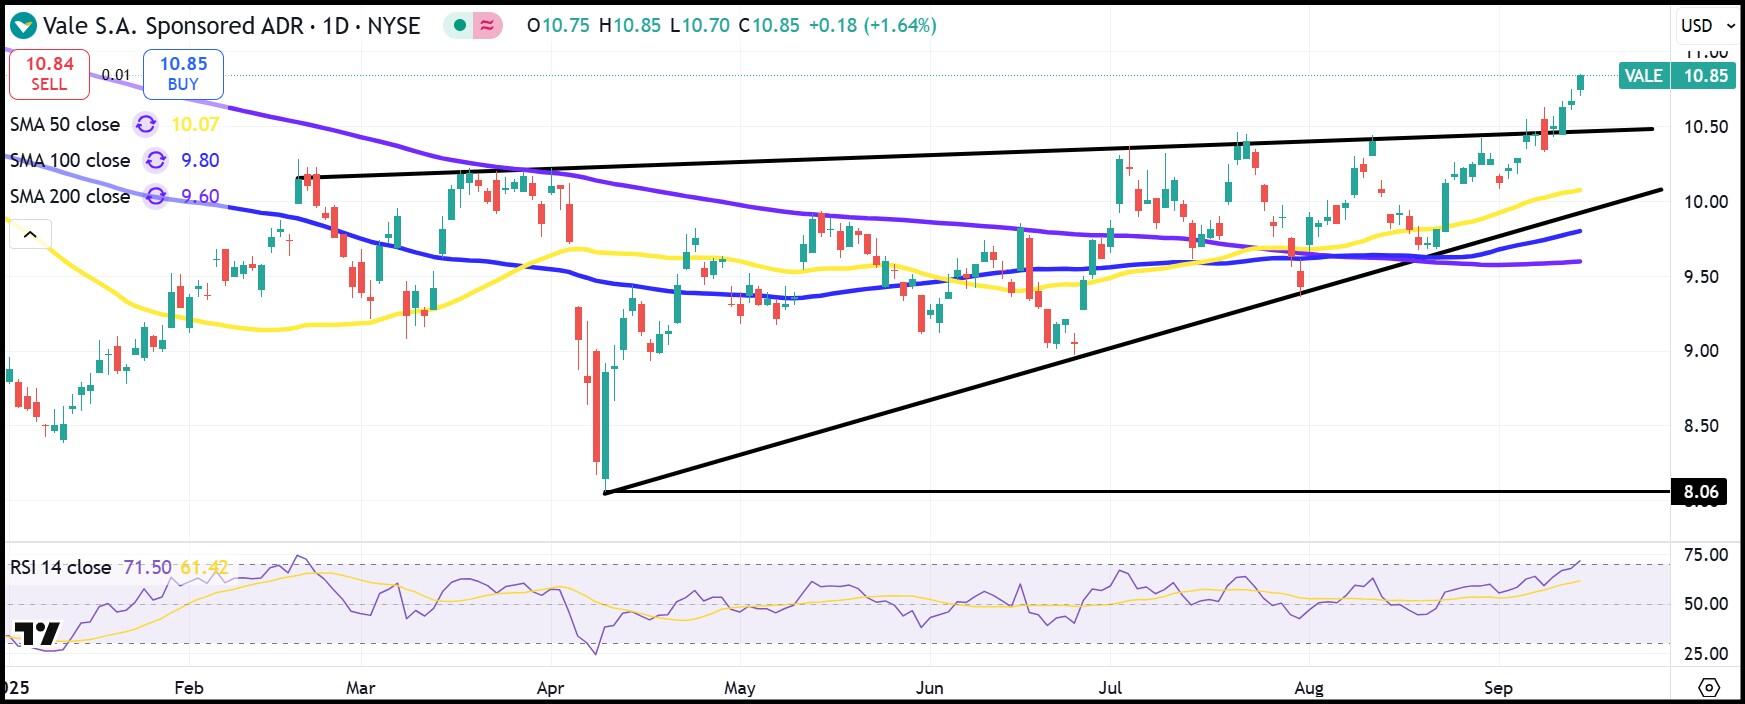
VALE daily stock chart
Disclaimer: The author owns shares in VALE.
Premium
You have reached your limit of 3 free articles for this month.
Start your subscription and get access to all our original articles.
Author

Clay Webster
FXStreet
Clay Webster grew up in the US outside Buffalo, New York and Lancaster, Pennsylvania. He began investing after college following the 2008 financial crisis.


