Apple (AAPL) Stock Forecast: AAPL rallies to break resistance, targets a break of $137 level
- Apple shares staged a strong rally to close up 2% on Monday.
- Nasdaq set the scene with a push to record highs.
- AAPL broke resistance and now targets $137.

Finally, Apple staged a strong rally as it had been languishing in a sideways range for the last couple of weeks. The post-earnings slump had led Apple lower to where it sat at a strong support zone since May. The shares had few catalysts to push them higher as the Nasdaq lagged the other main indices. Facebook (FB) gave some clues that a coming tech rally may be on the cards when it made new record highs last week, but still Apple failed to move.
However, the Nasdaq set fresh records and Apple duly roused itself. It is about time when one considers the strength of results back in late April, which caused the slide. Those results were 40% ahead of analyst expectations, but Apple slid despite that extensive beat and announced an increase to its share buyback program, as well as increasing its dividend.
-637593412957102910.png)
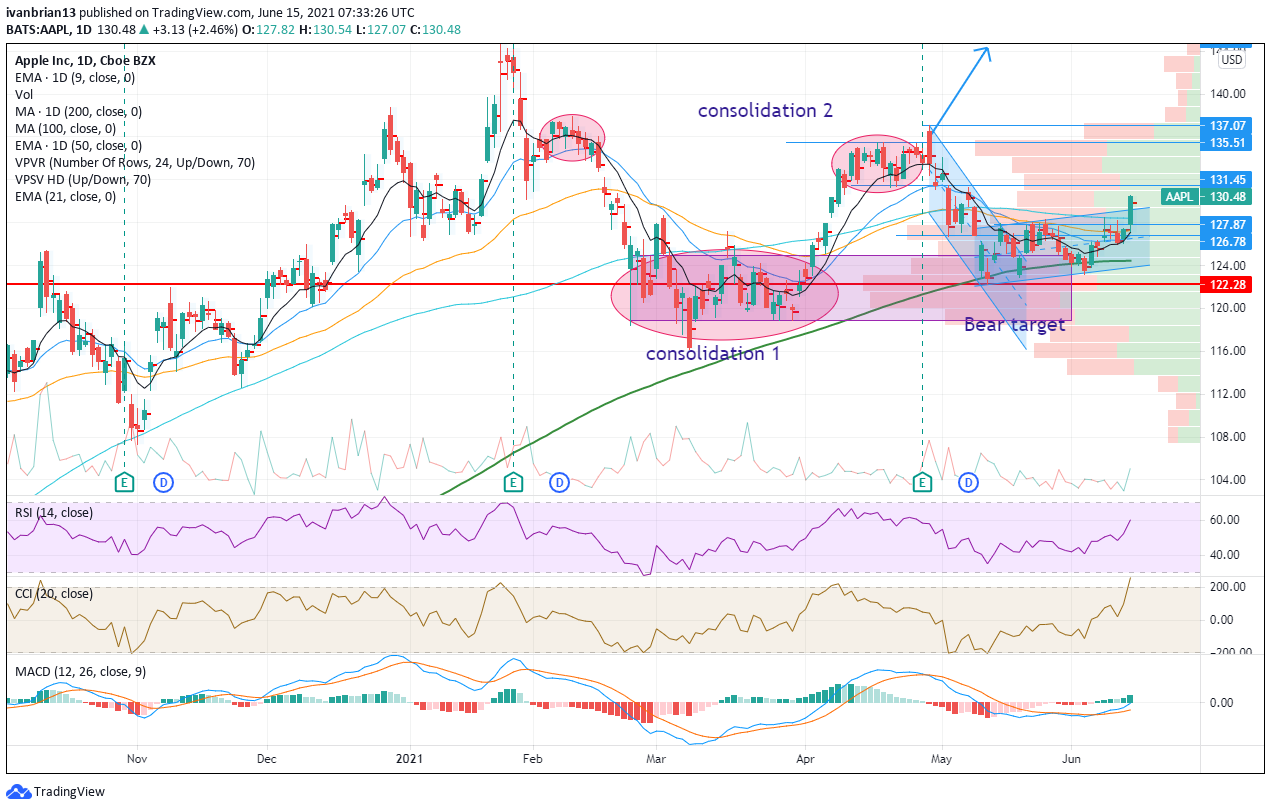
Apple stock forecast
The chart shows just how strong the support zone was with a long consolidation phase back in March and April. The 200-day moving average also provided further support in this area. A mostly sideways range followed before Monday's strong break of the $128.87 resistance level. AAPL shares also broke the recent uptrend channel. This brings $131.45 as the first target of resistance to get through. This level is the bottom of the consolidation phase that was broken by the release of the results. Again, this is a strong consolidation zone, so breaking through this consolidation area will take time. $137.07 caps the range, being the high from April 29, the day after results. Volume, as can be seen by the volume profile on the right side of the chart, drops off considerably once above $137. This means the move through $137 to fresh highs should prove easier.
AAPL shares have now broken the key 9-day moving average, a key trend identifier for short-term trading. Remaining above this level generally means long positions offer the higher risk reward. The Relative Strength Index (RSI) and the Commodity Channel Index (CCI) are trending higher with price but are not yet overbought. The MACD (Moving Average Convergence Divergence) has crossed into bullish territory.
Author

Ivan Brian
FXStreet
Ivan Brian started his career with AIB Bank in corporate finance and then worked for seven years at Baxter. He started as a macro analyst before becoming Head of Research and then CFO.


