Apple (AAPL) Stock Forecast: Three reasons why Apple is going to break all time highs
- AAPL shares break $140 in a continuation of a perfect technical move.
- Apple now on target for record highs above $145, as Nasdaq names power on.
- Equities continue to remain bullish as AMZN pops to all-time highs.
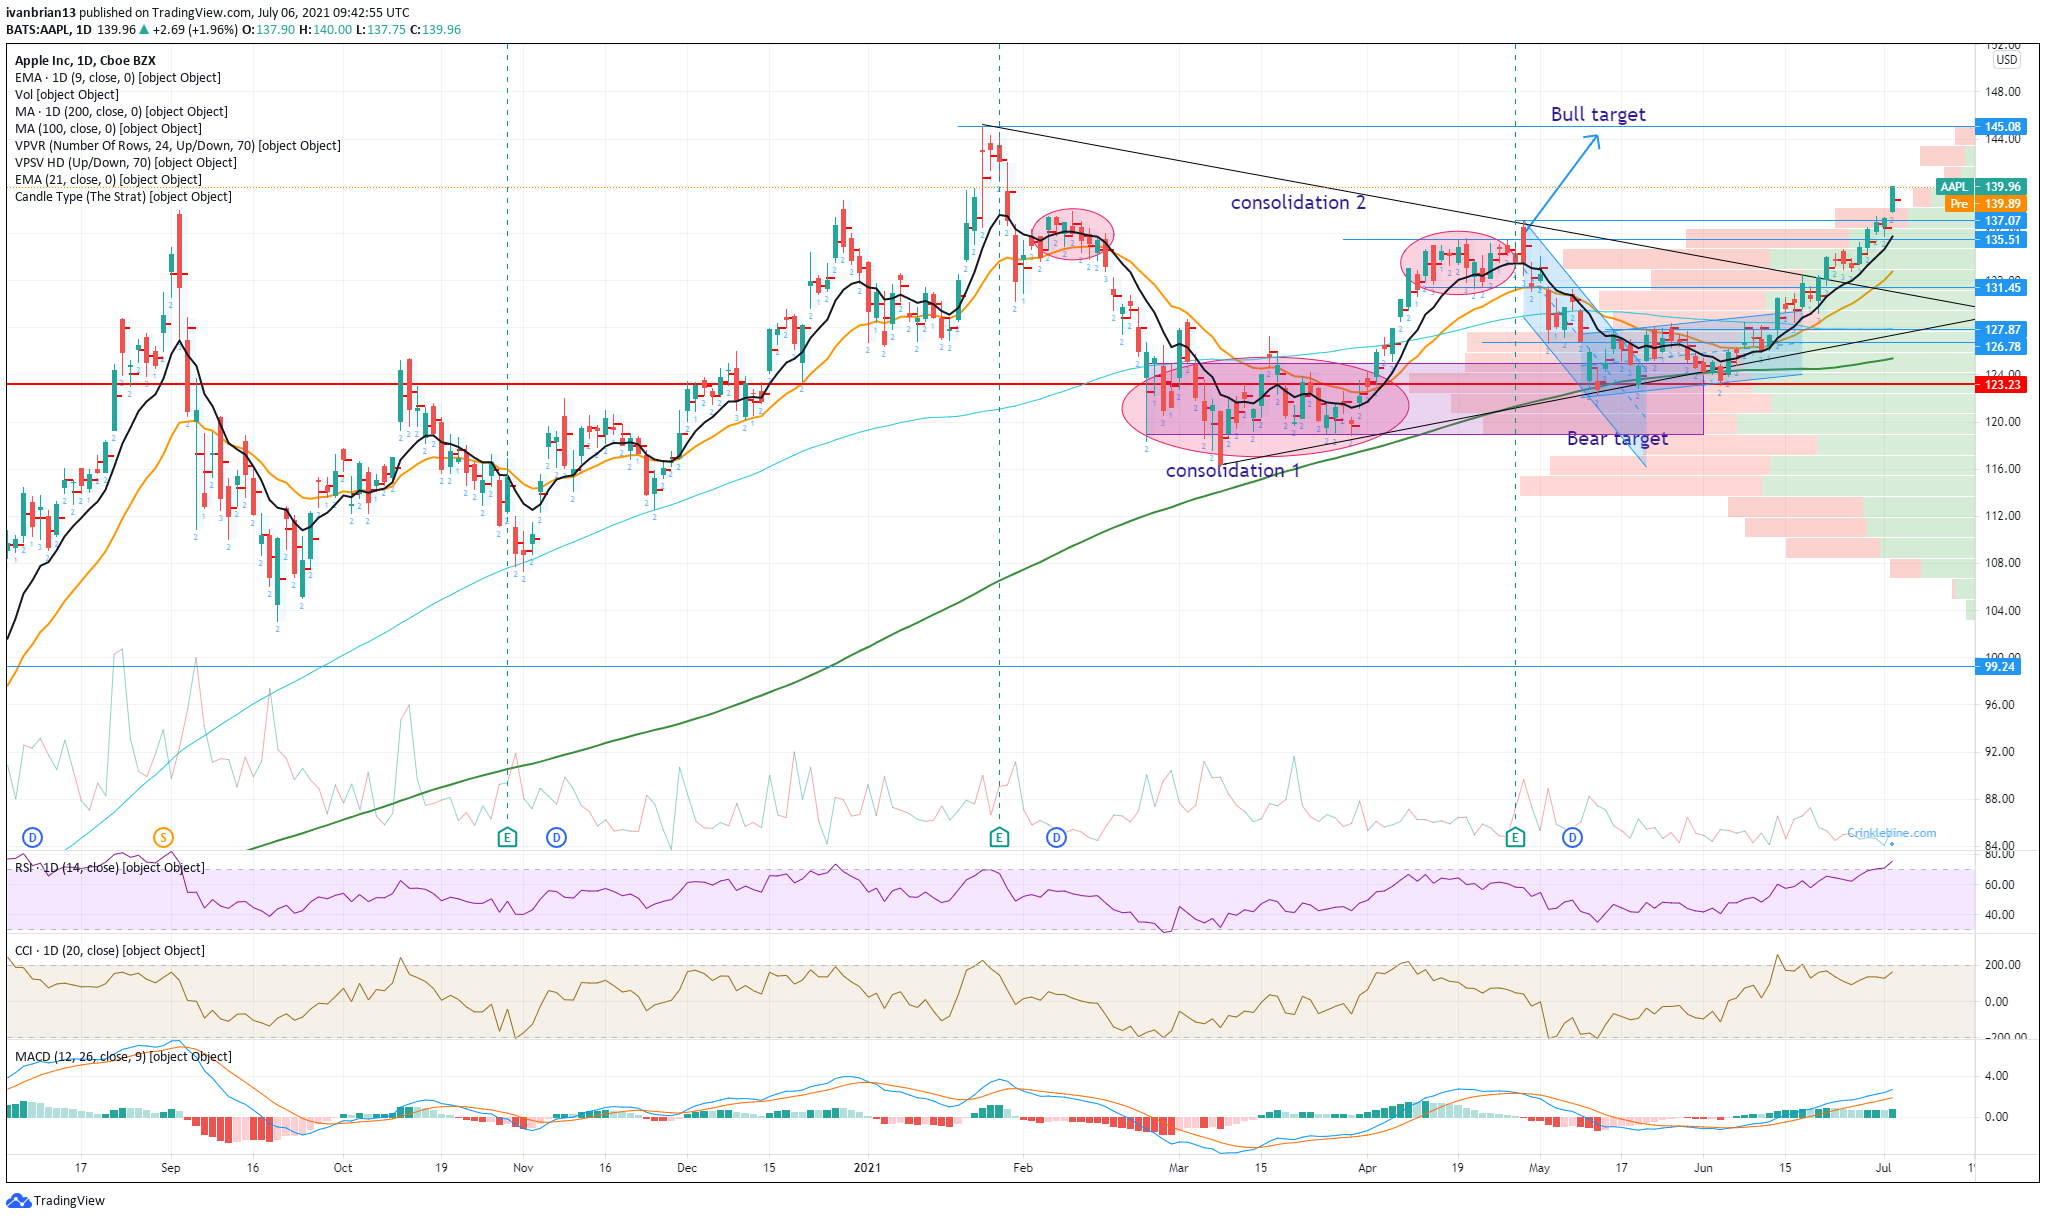
Update: Apple stock (AAPL) just keeps powering on and thankfully we have been on the right side of this call. The $137.07 level was the last of our key resistances to fall and above that the volume profile thins out nicely, clearing the way for a test of all-time highs above $145. So far so good as other mega tech names follow with AMZN surging 3% to record highs. Our three reasons plus bonus from earlier below remain intact.
- The trend is your friend and this one is strong. As long as Apple remains above $137 and the 9-day moving average then further gains are probable.
- The volume profile on the right of the chart is now thin. Meaning price moves are easier to accelerate here. Resistance is not as strong up here. We can also see how the zone below $135 is a strong volume support area.
- Equity markets overall remain bullish and seasonality is on our side. The first two weeks of July are historically the most profitable period for the Nasdaq.
- Here's a bonus extra reason if you want it, Apple's mega-tech peer group is also making record highs, so AAPL really needs to keep pace. GOOGL had a huge pop through record highs on Friday and Facebook (FB) and AMZN are just under their own record highs. AMZN updated through highs now!
-637611789879740687.png)
Apple just keeps on giving as investors remain faithful to the mega tech name. Finally, the stock awoke from its slumber in June and has pushed on impressively since bottoming out in the low $120s. A return of 13% over the past month is not too shabby for loyal investors and new traders who spotted the potential for the mega-tech name to bounce from lows. Thankfully, we had called this move so hopefully, those of you who jumped on board are still long and not wrong.
The bottoming out in mid-May of the post-results slump corresponded with a general turnaround for the Nasdaq names. The Fed had successfully battled away the inflation worries and tech bears went back into hibernation. Apple shares found strong support from a previous consolidation zone in the low $120s from February and March. Added to this, the 200-day moving average sat in this zone, so it was a good staging point to stall the slide and plan a move higher.
Apple posted Q1 results on April 28 which set the recent decline in motion. Those results were over 40% higher than what Wall Street analysts had been expecting and added to the package by announcing it was increasing its dividend and share buy-back program. Despite this, AAPL stock moved steadily lower after results, apart from one intraday spike to $137.07, the level we had been mentioning as our resistance target. Apple's negative reaction to the positive results eventually saw it slide over 10% before bottoming out in the low $120s.
-637611609812898008.png)
Friday, though, saw a powerful move above this $137.07 resistance we had been mentioning and brought AAPL stock into an area of light volume and so light resistance. This should make a move to test record highs above $145 that bit easier. The average Wall Street target as we can see from the table below at $159 is now in sight also.
Apple key statistics
| Market Cap | $2.33 trillion |
| Enterprise Value | $2.1 trillion |
| Price/Earnings (P/E) | 31 |
|
Price/Book | 35 |
| Price/Sales | 8.7 |
| Gross Margin | 40% |
| Net Margin | 23.4% |
| EBITDA | $100 billion |
| Average Wall Street rating and price target | Buy $159 |
Apple stock forecast
The break of $137.07, the high just after the release of the last results, can clearly be seen. AAPL has now finally retraced all those losses. The 9-day moving average is guiding the move higher and $145.08, the all-time high, does not look too far away. So, for now, $137 holds the bullish trend in place as short-term support and a break of this and the 9-day moving average just below would be questionable. The Relative Strength Index (RSI) has gone into the overbought territory but this does not mean a price decline is inevitable. The RSI is a lagging indicator, concerned with the relative speed of the move. So, if the price ascent slows, or a period of consolidation ensues, the RSI can go back into neutral territory without the price of Apple stock falling. But it still needs watching.
However, the risk-reward remains skewed in favour of further gains. So here are our three reasons you have been waiting for:
- The trend is your friend and this one is strong. As long as Apple remains above $137 and the 9-day moving average then further gains are probable.
- The volume profile on the right of the chart is now thin. Meaning price moves are easier to accelerate here. Resistance is not as strong up here. We can also see how the zone below $135 is a strong volume support area.
- Equity markets overall remain bullish and seasonality is on our side. The first two weeks of July are historically the most profitable period for the Nasdaq.
Here's a bonus extra reason if you want it, Apple's mega-tech peer group is also making record highs, so AAPL really needs to keep pace. GOOGL had a huge pop through record highs on Friday and Facebook (FB) and AMZN are just under their own record highs.
Premium
You have reached your limit of 3 free articles for this month.
Start your subscription and get access to all our original articles.
Author

Ivan Brian
FXStreet
Ivan Brian started his career with AIB Bank in corporate finance and then worked for seven years at Baxter. He started as a macro analyst before becoming Head of Research and then CFO.


