ANZ – WES Elliott Wave analysis [Video]
![ANZ – WES Elliott Wave analysis [Video]](https://editorial.fxstreet.com/images/Markets/Equities/Industries/Staples/pic-pexels-pixabay-256455-637435397029183920.jpg)
Greetings, Our Elliott Wave analysis today updates the Australian Stock Exchange (ASX) with ANZ GROUP HOLDINGS LIMITED - ANZ – WES. We see ANZ pushing lower in the near term, and there is weakness in the bull market trend.
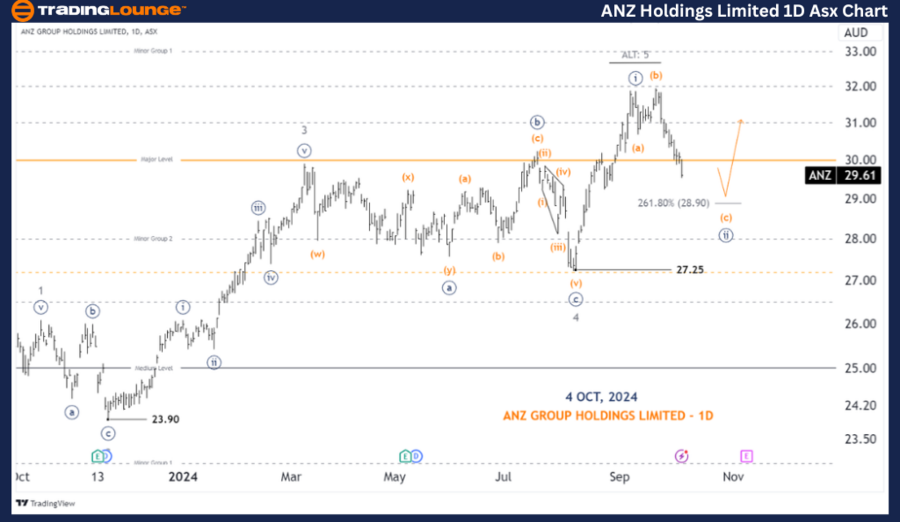
ASX: ANZ GROUP HOLDINGS LIMITED - ANZ – WES one day chart (Semilog scale) analysis
Function: Major trend (Minute degree, navy).
Mode: Motive.
Structure: Impulse.
Position: Wave (c)-orange of Wave ((ii))-navy of Wave 5-grey.
Details: Wave 5-grey may be unfolding to push higher, or it may have ended. So in either case, price will continue to push lower, aiming for the nearest target around 28.90. A further break of 27.25 would trigger the ALT alternative scenario, further indicating that the entire five-waves have ended with wave 5-grey, and a Big Correction is unfolding to push significantly lower.
Invalidation point: 27.25.
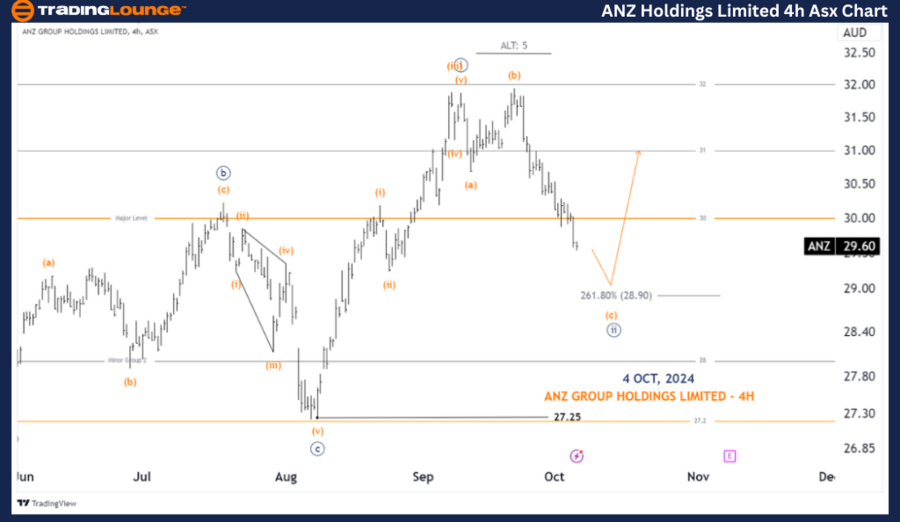
ASX: ANZ GROUP HOLDINGS LIMITED - ANZ – WES four-hour chart analysis
Function: Major trend (Minute degree, navy).
Mode: Motive.
Structure: Impulse.
Position: Wave (c)-orange of Wave ((ii))-navy.
Details: Wave ((ii))-navy will continue to push lower, it is developing as an Expanded Flat, and is targeting a low of 28.90. A break of this level will continue lower, and a break of 27.25 will trigger the alternative scenario that the 5-grey wave is actually over, and ANZ will push significantly lower.
Invalidation point: 27.25.
Conclusion:
Our analysis, forecast of contextual trends, and short-term outlook for ASX: ANZ GROUP HOLDINGS LIMITED - ANZ – WES aim to provide readers with insights into the current market trends and how to capitalize on them effectively. We offer specific price points that act as validation or invalidation signals for our wave count, enhancing the confidence in our perspective. By combining these factors, we strive to offer readers the most objective and professional perspective on market trends.
Technical analyst: Hua (Shane) Cuong, CEWA-M (Master’s Designation).
ASX: ANZ GROUP HOLDINGS LIMITED - ANZ – WES four-hour chart analysis [Video]
Author

Peter Mathers
TradingLounge
Peter Mathers started actively trading in 1982. He began his career at Hoei and Shoin, a Japanese futures trading company.


